
Compare Clean Max Enviro with Similar Stocks
Dashboard
High Management Efficiency with a high ROCE of 0%
Strong ability to service debt as the company has a low Debt to EBITDA ratio of 1.96 times
Healthy long term growth as Net Sales has grown by an annual rate of 0% and Operating profit at 0%
Flat results in Mar 26
With ROCE of 16.5, it has a Fair valuation with a 2.4 Enterprise value to Capital Employed
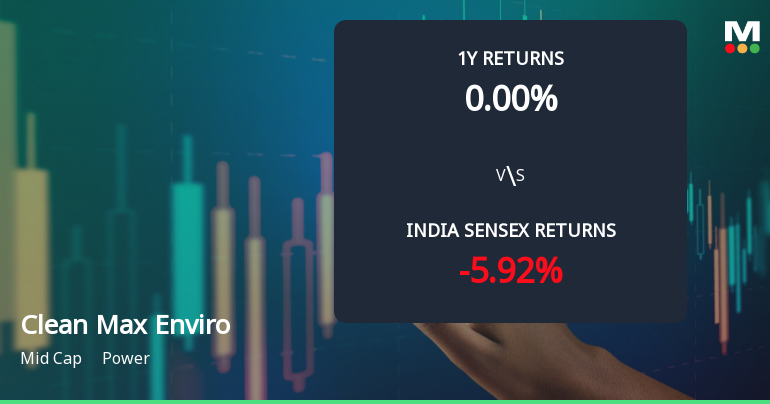
Total Returns (Price + Dividend) 
Clean Max Enviro for the last several years.
Risk Adjusted Returns v/s
Returns Beta

News
Clean Max Enviro Energy Solutions Ltd Technical Momentum Shifts to Sideways Amid Mixed Signals
Clean Max Enviro Energy Solutions Ltd has experienced a notable shift in its technical momentum, moving from a mildly bearish stance to a more sideways trend, reflecting a period of consolidation amid mixed indicator signals. Despite a recent downgrade in daily price, the stock’s medium-term outlook shows signs of stabilisation, prompting a reassessment of its technical and fundamental positioning within the power sector.
Read full news article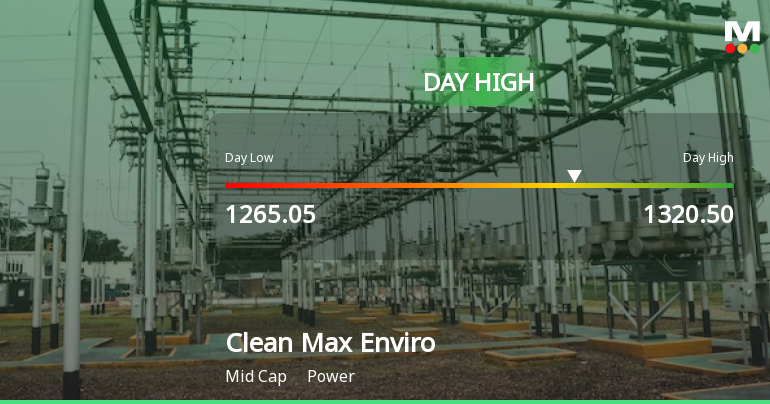
Clean Max Enviro Energy Solutions Ltd Rallies 5.01% and Approaches 20 DMA Resistance — A Key Technical Test Ahead
The Sensex climbed 0.71% on 09 Jul 2026, yet Clean Max Enviro Energy Solutions Ltd outperformed with a 5.01% gain, touching an intraday high of Rs 1320.5. This 4.12 percentage-point outperformance signals a stock-specific momentum shift rather than a broad market lift.
Read full news article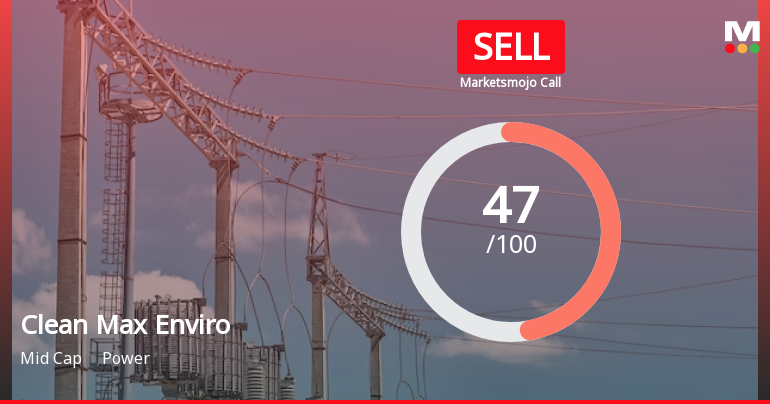
Clean Max Enviro Energy Solutions Downgraded to Sell Amid Technical and Financial Concerns
Clean Max Enviro Energy Solutions Ltd, a mid-cap player in the power sector, has seen its investment rating downgraded from Hold to Sell as of 8 July 2026. The downgrade reflects a combination of deteriorating technical indicators, disappointing quarterly earnings, and valuation concerns, despite some strengths in management efficiency and debt servicing ability.
Read full news article Announcements
Outcome Of The Meeting Of Risk Management Committee Of The Board Of Directors Of Clean Max Enviro Energy Solutions Limited (Formerly Known As Clean Max Enviro Energy Solutions Private Limited) (The Company) Held On 15 July 2026
15-Jul-2026 | Source : BSEIntimation of outcome of Risk Management Committee of the Board of Directors of the Company at its meeting held today i.e. 15 July 2026 has inter alia approved the issuance of corporate guarantee for the facility being availed by the subsidiary company of the Company.
Compliances-Certificate under Reg. 74 (5) of SEBI (DP) Regulations 2018
13-Jul-2026 | Source : BSEEnclosed herewith certificate issued by MUFG Intime India Private Limited pursuant to Regulation 74(5) of the Securities and Exchange Board of India (Depositories and Participants) Regulations 2018 as amended
Announcement under Regulation 30 (LODR)-Allotment of ESOP / ESPS
13-Jul-2026 | Source : BSEAllotment of 8740 Shares under Clean Max Enviro Energy Solutions Limited Employee Stock Option Scheme 2015 as amended
Corporate Actions

No Upcoming Board Meetings

No Dividend history available

No Splits history available

No Bonus history available

No Rights history available
Quality key factors
Valuation key factors
Technicals key factors
 Technical Indicator Scale: Bearish, Mildly Bearish, Sideways, Mildly Bullish, Bullish Turned
 Shareholding Snapshot : Mar 2026
Shareholding Compare (%holding)
Promoters
20.0202
Held by 8 Schemes (2.26%)
Held by 36 FIIs (29.8%)
Bgtf One Holdings (difc) Limited (21.31%)
Augment India I Holding Llc (9.52%)
3.32%
Quarterly Results Snapshot (Standalone) - Mar'26 - QoQ

QoQ Growth in quarter ended Mar 2026 is 24.69% vs 4.34% in Dec 2025

QoQ Growth in quarter ended Mar 2026 is -53.94% vs 13.07% in Dec 2025
Half Yearly Results Snapshot (Standalone) - Sep'25
Not Applicable: The company has declared_date for only one period
Not Applicable: The company has declared_date for only one period
Nine Monthly Results Snapshot (Standalone) - Dec'25
Not Applicable: The company has declared_date for only one period
Not Applicable: The company has declared_date for only one period
Annual Results Snapshot (Standalone) - Mar'26
YoY Growth in year ended Mar 2026 is 164.42% vs 7.78% in Mar 2025
YoY Growth in year ended Mar 2026 is 157.39% vs 5.57% in Mar 2025
About Clean Max Enviro Energy Solutions Ltd

Company Coordinates


