
Compare Clean Max Enviro with Similar Stocks
Dashboard
High Management Efficiency with a high ROCE of 0%
Strong ability to service debt as the company has a low Debt to EBITDA ratio of 1.96 times
Healthy long term growth as Net Sales has grown by an annual rate of 0% and Operating profit at 0%
Flat results in Mar 26
With ROCE of 16.5, it has a Fair valuation with a 2.4 Enterprise value to Capital Employed
Total Returns (Price + Dividend) 
Clean Max Enviro for the last several years.
Risk Adjusted Returns v/s
Returns Beta

News
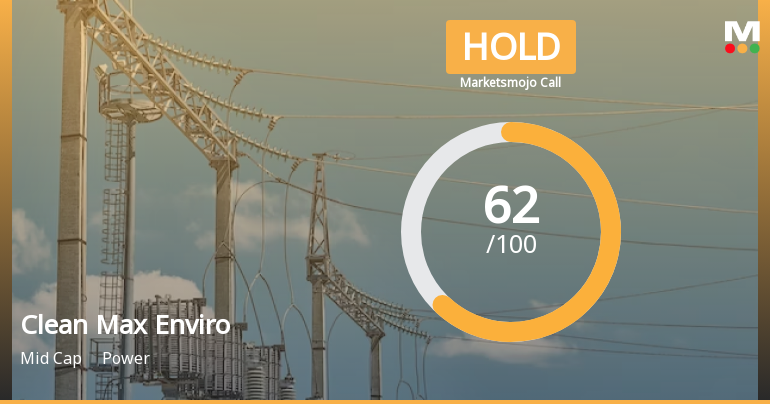
Clean Max Enviro Energy Solutions Ltd Upgraded to Hold on Improved Technicals and Fair Valuation
Clean Max Enviro Energy Solutions Ltd has seen its investment rating upgraded from Sell to Hold, reflecting notable improvements across technical indicators and valuation metrics. The company’s enhanced market performance, alongside steady financial trends and quality parameters, has prompted this reassessment, signalling a more balanced outlook for investors in the power sector.
Read full news article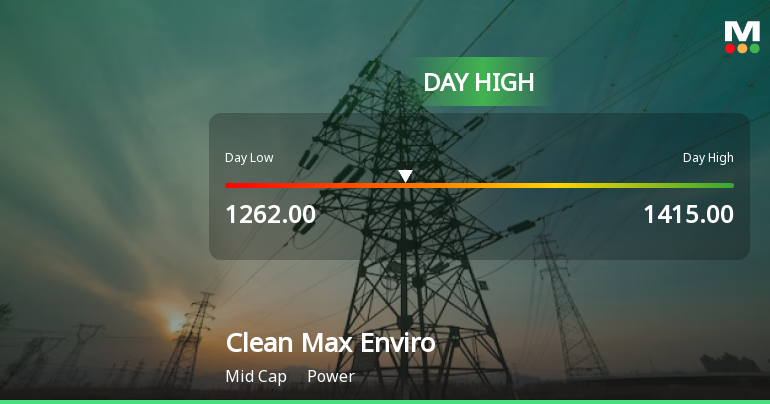
Clean Max Enviro Energy Solutions Ltd Surges 7.15% to Day's High of Rs 1415 — Outperforms Sector by 7.97 Percentage Points
The Sensex climbed 0.67% on 10 Jun 2026, yet Clean Max Enviro Energy Solutions Ltd outpaced the broader market with a 7.15% gain, reaching a fresh 52-week and all-time high of Rs 1415. This 7.97 percentage-point outperformance over its Power sector peers signals a distinctly stock-specific rally rather than a market-wide lift.
Read full news article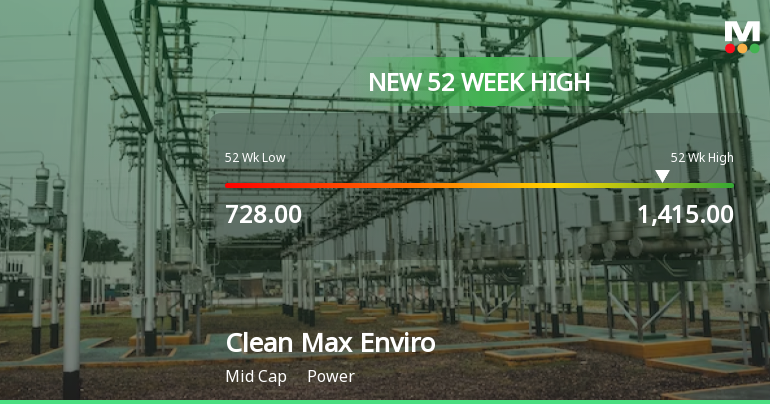
Broad-Based Technical Strength Lifts Clean Max Enviro Energy Solutions Ltd to 52-Week High of Rs 1415
With a decisive surge to Rs 1415 on 10 Jun 2026, Clean Max Enviro Energy Solutions Ltd has reached a fresh 52-week and all-time high, propelled by a confluence of strong technical indicators and sustained price momentum.
Read full news article Announcements
Announcement under Regulation 30 (LODR)-Analyst / Investor Meet - Intimation
10-Jun-2026 | Source : BSEIntimation of Schedule of Analysts/Institutional Investors Meet through HSBC Annual Asia Conference
Announcement under Regulation 30 (LODR)-Press Release / Media Release
10-Jun-2026 | Source : BSEPress Release titled Meta and CleanMax Partner on ~900 MW of Renewable Energy Capacity in India to be issued by Clean Max Enviro Energy Solutions Limited
Announcement under Regulation 30 (LODR)-Analyst / Investor Meet - Intimation
10-Jun-2026 | Source : BSEIntimation of Schedule of Analysts/Institutional Investors Meet with Antiques India Conclave
Corporate Actions

No Upcoming Board Meetings

No Dividend history available

No Splits history available

No Bonus history available

No Rights history available
Quality key factors
Valuation key factors
Technicals key factors
 Technical Indicator Scale: Bearish, Mildly Bearish, Sideways, Mildly Bullish, Bullish Turned
 Shareholding Snapshot : Mar 2026
Shareholding Compare (%holding)
Promoters
20.0202
Held by 8 Schemes (2.26%)
Held by 36 FIIs (29.8%)
Bgtf One Holdings (difc) Limited (21.31%)
Augment India I Holding Llc (9.52%)
3.32%
Quarterly Results Snapshot (Standalone) - Mar'26 - QoQ

QoQ Growth in quarter ended Mar 2026 is 24.69% vs 4.34% in Dec 2025

QoQ Growth in quarter ended Mar 2026 is -53.94% vs 13.07% in Dec 2025
Half Yearly Results Snapshot (Standalone) - Sep'25
Not Applicable: The company has declared_date for only one period
Not Applicable: The company has declared_date for only one period
Nine Monthly Results Snapshot (Standalone) - Dec'25
Not Applicable: The company has declared_date for only one period
Not Applicable: The company has declared_date for only one period
Annual Results Snapshot (Standalone) - Mar'26
YoY Growth in year ended Mar 2026 is 164.42% vs 7.78% in Mar 2025
YoY Growth in year ended Mar 2026 is 157.39% vs 5.57% in Mar 2025
About Clean Max Enviro Energy Solutions Ltd

Company Coordinates


