
Compare Clean Science with Similar Stocks
Dashboard
Poor long term growth as Net Sales has grown by an annual rate of 13.30% and Operating profit at 2.79% over the last 5 years
Flat results in Mar 26
With ROE of 14.5, it has a Very Expensive valuation with a 4.9 Price to Book Value
Consistent Underperformance against the benchmark over the last 3 years
Stock DNA
Specialty Chemicals
INR 7,831 Cr (Small Cap)
34.00
44
0.83%
-0.24
14.50%
4.88
Total Returns (Price + Dividend) 
Latest dividend: 1.9972427622509086 per share ex-dividend date: Feb-06-2026
Risk Adjusted Returns v/s
Returns Beta

News
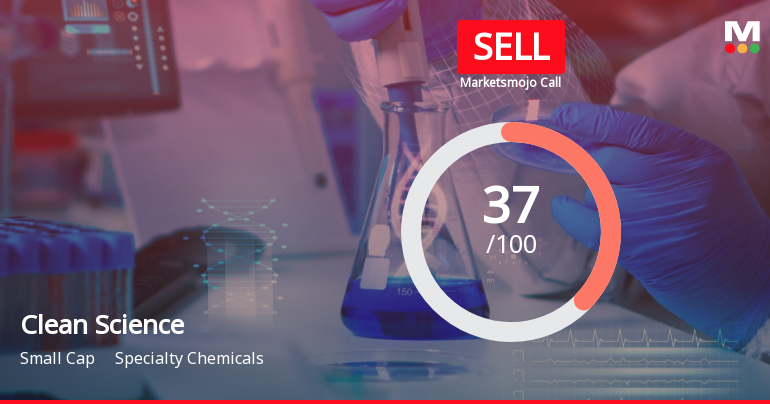
Clean Science & Technology Ltd is Rated Sell
Clean Science & Technology Ltd is rated 'Sell' by MarketsMOJO, with this rating last updated on 15 Apr 2026. However, the analysis and financial metrics discussed here reflect the stock's current position as of 24 July 2026, providing investors with an up-to-date perspective on its performance and outlook.
Read full news article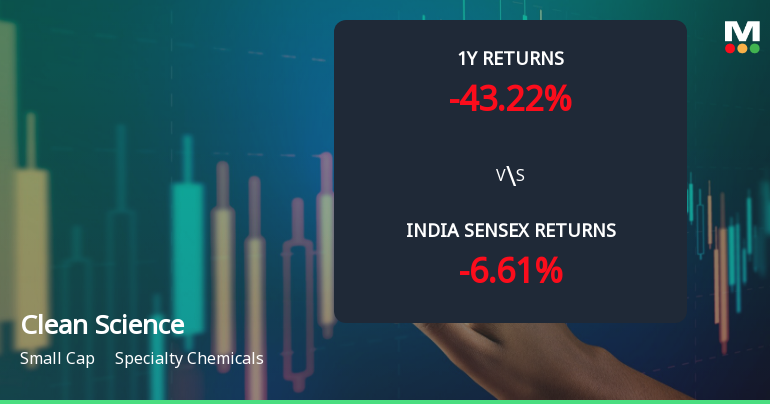
Clean Science & Technology Ltd Faces Bearish Momentum Amid Technical Parameter Shift
Clean Science & Technology Ltd, a small-cap player in the Specialty Chemicals sector, has experienced a notable shift in its technical momentum, reflecting growing bearish sentiment. Recent technical indicators reveal a complex picture with mixed signals across weekly and monthly timeframes, underscoring the challenges faced by the stock amid broader market pressures and sector dynamics.
Read full news article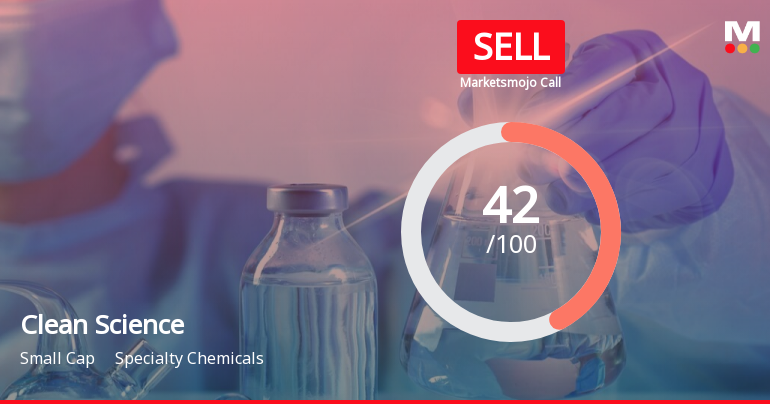
Clean Science & Technology Ltd is Rated Sell
Clean Science & Technology Ltd is rated 'Sell' by MarketsMOJO, with this rating last updated on 15 Apr 2026. However, the analysis and financial metrics discussed here reflect the stock's current position as of 13 July 2026, providing investors with the latest insights into its performance and outlook.
Read full news article Announcements
Announcement under Regulation 30 (LODR)-Analyst / Investor Meet - Intimation
21-Jul-2026 | Source : BSEPursuant to Regulation 30 read with Schedule III - Part A of the SEBI Listing Regulations 2015 we wish to inform you that the Company has scheduled a conference call for analysts and investors on Saturday 1st August 2026 at 4:00 P.M. (IST) to discuss the unaudited financial results of the Company for the quarter ended 30th June 2026.
Board Meeting Intimation for Prior Intimation Of The Board Meeting To Consider Un-Audited Standalone And Consolidated Financial Results For The Quarter Ended 30Th June 2026.
17-Jul-2026 | Source : BSEClean Science And Technology Ltdhas informed BSE that the meeting of the Board of Directors of the Company is scheduled on 01/08/2026 inter alia to consider and approve Pursuant to Regulation 29 of SEBI (Listing Obligations and Disclosure Requirements) Regulations 2015 intimation is hereby given that a meeting of the Board of Directors of the Company will be held on Saturday 1st August 2026 to inter alia consider and approve the Un-audited Standalone and Consolidated Financial Results for the First Quarter ended 30th June 2026.
Intimation Regarding Clean-Fino Chem Limited -Wholly Owned Subsidiary Regarding Definitive Agreements For A Long-Term Strategic Collaboration With Geneus Chem AG A Company Incorporated Under The Laws Of Switzerland.
16-Jul-2026 | Source : BSEEnclosed are the details
Corporate Actions

01 Aug 2026

Clean Science & Technology Ltd has declared 200% dividend, ex-date: 06 Feb 26

No Splits history available

No Bonus history available

No Rights history available
Quality key factors
Valuation key factors
Technicals key factors
 Technical Indicator Scale: Bearish, Mildly Bearish, Sideways, Mildly Bullish, Bullish Turned
 Shareholding Snapshot : Jun 2026
Shareholding Compare (%holding)
Promoters
None
Held by 19 Schemes (12.0%)
Held by 97 FIIs (13.37%)
Ashokkumar Ramkishan Sikchi Huf (9.96%)
Amansa Holdings Private Limited (4.37%)
12.39%
Quarterly Results Snapshot (Consolidated) - Mar'26 - QoQ

QoQ Growth in quarter ended Mar 2026 is 13.47% vs -10.25% in Dec 2025
QoQ Growth in quarter ended Mar 2026 is 27.01% vs -17.23% in Dec 2025
Half Yearly Results Snapshot (Consolidated) - Sep'25

Growth in half year ended Sep 2025 is 5.48% vs 25.17% in Sep 2024
Growth in half year ended Sep 2025 is 0.66% vs 12.19% in Sep 2024
Nine Monthly Results Snapshot (Consolidated) - Dec'25
YoY Growth in nine months ended Dec 2025 is 0.59% vs 24.65% in Dec 2024
YoY Growth in nine months ended Dec 2025 is -9.95% vs 9.53% in Dec 2024
Annual Results Snapshot (Consolidated) - Mar'26
YoY Growth in year ended Mar 2026 is -1.04% vs 22.13% in Mar 2025
YoY Growth in year ended Mar 2026 is -13.14% vs 8.35% in Mar 2025
About Clean Science & Technology Ltd

Company Coordinates


