Clean Science

  • Market Cap: Small Cap
  • Industry: Specialty Chemicals
  • ISIN: INE227W01023
  • NSEID: CLEAN
  • BSEID: 543318
INR
857.00
-6.15 (-0.71%)
BSENSE

Sep 03, 11:12 AM

BSE+NSE Vol: 3.95 lacs

  • Price Points
  • Score
  • Mojo Parameters
  • Total Return
  • News and Corporate Actions
  • Key factors
  • Shareholding
  • Financials
  • CompanyCV
stock-summaryPrice Point
High/Low

1Day

52 Week

Valuation
Technical
Day's Volume

CASH

3.95 lacs (422.61%) Volume

Shareholding (Jun 2026)

FII

13.37%

Held by 97 FIIs

DII

16.24%

Held by 23 DIIs

Promoter

51.29%

Why is Clean Science & Technology Ltd falling/rising?

03-Sep-2026

As of 02-Sep, Clean Science & Technology Ltd's stock price is rising to 863.20, reflecting a 4.38% increase. This growth is supported by strong recent performance, positive technical indicators, increased investor participation, and solid financial metrics.

As of 02-Sep, Clean Science & Technology Ltd's stock price is rising, currently at 863.20, reflecting a change of 36.25 (4.38%) upward. This increase is supported by several positive factors. Over the past week, the stock has outperformed the Sensex, gaining 4.09% while the benchmark fell by 1.17%. In the last month, the stock has shown a significant increase of 17.47%, contrasting with a decline of 1.95% in the Sensex.<BR><BR>Today's performance indicates that the stock has outperformed its sector by 4.95% and has been on a consecutive gain for the last two days, accumulating a total return of 4.86% during this period. The stock reached an intraday high of Rs 870.5, marking a 5.27% increase. Additionally, Clean Science is trading above its 5-day, 20-day, 50-day, 100-day, and 200-day moving averages, which is a positive technical indicator.<BR><BR>Investor participation has also increased, with a delivery volume of 97.54k on September 1, rising by 5.45% compared to the 5-day average. The stock's liquidity is deemed sufficient for trading, indicating a healthy market interest.<BR><BR>Moreover, the company boasts high management efficiency with a return on equity (ROE) of 22.48% and is net-debt free, which are attractive traits for investors. High institutional holdings at 29.61% suggest that knowledgeable investors are backing the stock, further contributing to its upward momentum.<BR><BR>In summary, the combination of strong recent performance, positive technical indicators, increased investor participation, and solid financial metrics are driving the rise in Clean Science & Technology Ltd's stock price.

View full answer

Who are in the management team of Clean Science?

01-Sep-2026

The management team of Clean Science includes Pradeep R Rathi (Chairman), Ashok Ramnarayan Boob (Managing Director), Krishnakumar Ramnarayan Boob (Whole-time Director), and several independent directors, among others, who guide the company's strategic direction and operations.

The management team of Clean Science includes the following key members:<BR><BR>1. **Pradeep R Rathi** - Chairman & Non-Executive Director<BR>2. **Ashok Ramnarayan Boob** - Managing Director<BR>3. **Krishnakumar Ramnarayan Boob** - Whole-time Director<BR>4. **Sanjay Kothari** - Director<BR>5. **Ganapati D Yadav** - Independent Director<BR>6. **Keval Navinchandra Doshi** - Independent Director<BR>7. **Madhu Dubhashi** - Independent Director<BR>8. **Mahesh Arvind Kulkarni** - Company Secretary & Compliance Officer<BR>9. **Siddhartha Ashok Sikchi** - Whole-time Director<BR><BR>This team plays a crucial role in guiding the company's strategic direction and operations.

View full answer

What does Clean Science do?

01-Sep-2026

Clean Science and Technology Ltd is a small-cap company in the specialty chemicals industry, reporting net sales of 268 Cr and a net profit of 73 Cr for June 2026. Key metrics include a P/E ratio of 38.00 and a market cap of INR 8,700 Cr.

Overview:<BR>Clean Science and Technology Ltd operates in the specialty chemicals industry and is categorized as a small-cap company.<BR><BR>History:<BR>The company was originally incorporated as 'Sri Distikemi Private Limited' in 2003 and later changed its name to 'Clean Science and Technology Private Limited' in 2006. The latest quarterly results reported net sales and net profit for June 2026.<BR><BR>Financial Snapshot:<BR>Net Sales: 268 Cr (Quarterly Results - Jun 2026) <BR>Net Profit: 73 Cr (Quarterly Results - Jun 2026) <BR>Market Cap: INR 8,700 Cr (Small Cap)<BR><BR>Key Metrics:<BR>P/E: 38.00 <BR>Industry P/E: 43 <BR>Dividend Yield: 0.72% <BR>Debt-Equity: -0.24 <BR>Return on Equity: 14.50% <BR>Price to Book: 5.62 <BR><BR>Contact Details:<BR>Details: No Company Details Available <BR>Registrar Address: Not available.

View full answer

Who are the peers of the Clean Science?

01-Sep-2026

Clean Science's peers include Vinati Organics, Privi Speciality, Jubilant Ingrevia, Alkyl Amines, Elantas Beck, Galaxy Surfactants, Balaji Amines, Archean Chemical, and Neogen Chemicals. In terms of performance, Privi Speciality leads with a 1-year return of 56.88%, while Clean Science has the lowest at -29.77%.

Peers: The peers of Clean Science are Vinati Organics, Privi Speci., Jubilant Ingrev., Alkyl Amines, Elantas Beck, Galaxy Surfact., Balaji Amines, Archean Chemical, and Neogen Chemicals.<BR><BR>Quality Snapshot: Excellent management risk is observed at Clean Science and Fineotex Chem, while Good management risk is found at Vinati Organics, Privi Speci., Jubilant Ingrev., Alkyl Amines, Elantas Beck, and Archean Chemical. Average management risk is present at Galaxy Surfact., Balaji Amines, and Neogen Chemicals. In terms of Growth, Clean Science and the peers of Vinati Organics, Jubilant Ingrev., Alkyl Amines, Elantas Beck, Galaxy Surfact., Balaji Amines, Archean Chemical, and Neogen Chemicals all exhibit Below Average growth, while Privi Speci. and Fineotex Chem show Good growth. Regarding Capital Structure, Clean Science, Vinati Organics, Jubilant Ingrev., Alkyl Amines, Elantas Beck, Galaxy Surfact., Balaji Amines, and Archean Chemical have Excellent capital structures, whereas Privi Speci. and Neogen Chemicals have Below Average capital structures.<BR><BR>Return Snapshot: The peer with the highest 1-year return is Privi Speci. at 56.88%, while the lowest is Clean Science at -29.77%. Clean Science's 1-year return is significantly lower than its peers. Additionally, the peers with negative six-month returns include Jubilant Ingrev. and Archean Chemical.

View full answer

How big is Clean Science?

01-Sep-2026

As of 31st August, Clean Science & Technology Ltd has a market capitalization of 8,700.00 Cr, with recent Net Sales of 982.10 Cr and a Net Profit of 232.93 Cr.

As of 31st August, Clean Science & Technology Ltd has a market capitalization of 8,700.00 Cr, categorizing it as a Small Cap company.<BR><BR>In the latest four quarters, the company reported Net Sales of 982.10 Cr and a Net Profit of 232.93 Cr.<BR><BR>The latest annual period for the balance sheet is March 2026, with Shareholder's Funds amounting to 1,583.77 Cr and Total Assets valued at 1,770.26 Cr.

View full answer

Are Clean Science & Technology Ltd latest results good or bad?

02-Aug-2026

Clean Science & Technology Ltd's latest results show strong revenue growth with net sales reaching ₹268.43 crores, but declining operating margins and a 39.82% drop in stock price indicate operational challenges and a cautious outlook. Overall, the results are more concerning than positive.

Clean Science & Technology Ltd's latest results present a mixed picture. On one hand, the company achieved a record high in net sales, reaching ₹268.43 crores, which reflects a sequential growth of 7.70% and a year-on-year increase of 10.52%. This indicates some resilience in revenue generation after a challenging fiscal year in 2025.<BR><BR>However, the profitability metrics reveal more concerning trends. While net profit increased by 25.88% quarter-on-quarter to ₹73.35 crores, the operating margin has contracted significantly. The operating margin (excluding other income) fell to 35.92%, down from 38.42% in the previous quarter and 41.11% a year ago. This decline in margins suggests that the company is facing mounting cost pressures, which could impact its overall operational health.<BR><BR>Furthermore, the stock has seen a substantial decline of 39.82% over the past year, indicating a bearish trend in the market perception of the company. The combination of strong revenue growth but declining margins creates a nuanced situation where, despite some positive indicators, the overall outlook remains cautious due to the operational challenges and market performance.<BR><BR>In summary, while Clean Science & Technology has demonstrated revenue resilience, the significant margin compression and stock performance issues suggest that the latest results are more concerning than positive.

View full answer

Should I buy, sell or hold Clean Science & Technology Ltd?

02-Aug-2026

Has Clean Science & Technology Ltd declared dividend?

01-Feb-2026

Yes, Clean Science & Technology Ltd has declared a dividend of 200%, amounting to ₹4 per share, with an ex-date of February 6, 2026. However, the company's stock has experienced significant negative returns over various periods, indicating challenging performance despite the dividend.

Clean Science & Technology Ltd has declared a dividend.<BR><BR>Dividend Details:<BR>- Percentage announced: 200%<BR>- Amount per share: 4 per share<BR>- Ex-date: 06 Feb 26<BR><BR>Dividend Yield: 0.7%.<BR><BR>Total Returns by Period:<BR>In the 3-month period, the price return was -20.27%, the dividend return was 0.20%, resulting in a total return of -20.07%.<BR><BR>In the 6-month period, the price return was -35.02%, the dividend return was 0.49%, leading to a total return of -34.53%.<BR><BR>For the 1-year period, the price return was -40.82%, the dividend return was 0.55%, culminating in a total return of -40.27%.<BR><BR>Over the 2-year period, the price return was -42.37%, the dividend return was 0.57%, resulting in a total return of -41.8%.<BR><BR>In the 3-year period, the price return was -39.38%, the dividend return was 0.90%, leading to a total return of -38.48%.<BR><BR>For the 4-year period, the price return was -64.48%, the dividend return was 0.98%, culminating in a total return of -63.5%.<BR><BR>In the 5-year period, the price return was 0%, the dividend return was 0%, resulting in a total return of 0.0%.<BR><BR>Overall, while Clean Science & Technology Ltd has declared a substantial dividend, the total returns over various periods indicate significant negative performance, particularly in the longer term. The dividend yield is modest, suggesting that despite the dividend declaration, the company's stock performance has been challenging.

View full answer

How has been the historical performance of Clean Science?

06-Nov-2025

Clean Science has shown consistent growth in net sales and profitability, with net sales increasing from 419.30 Cr in March 2020 to 966.64 Cr in March 2025, despite a dip in March 2023. The company also demonstrated strong earnings growth, with profit before tax reaching 356.73 Cr and earnings per share rising to 24.87 in March 2025.

Answer:<BR>The historical performance of Clean Science shows a consistent growth trajectory in net sales and profitability over the years.<BR><BR>Breakdown:<BR>Clean Science has demonstrated significant growth in net sales, increasing from 419.30 Cr in March 2020 to 966.64 Cr in March 2025, with a notable dip in March 2023 at 935.80 Cr. The total operating income followed a similar trend, reaching 966.64 Cr in March 2025. The raw material costs have also risen, from 127.98 Cr in March 2020 to 368.34 Cr in March 2025, while total expenditure (excluding depreciation) increased from 234.02 Cr to 579.02 Cr over the same period. Operating profit (PBDIT) peaked at 512.33 Cr in March 2023 but fell to 426.21 Cr in March 2025. Profit before tax showed a steady increase, reaching 356.73 Cr in March 2025, while profit after tax was 264.41 Cr. The earnings per share (EPS) rose from 13.12 in March 2020 to 24.87 in March 2025, despite a peak of 35.37 in March 2023. The company's total assets grew significantly from 429.88 Cr in March 2020 to 1,599.51 Cr in March 2025, with total liabilities also increasing from 429.88 Cr to 1,599.51 Cr. Cash flow from operating activities improved to 213.00 Cr in March 2025, while the net cash inflow was 9.00 Cr, indicating a positive cash position. Overall, Clean Science has shown robust growth in both revenue and profitability, alongside a solid asset base.

View full answer

Is Clean Science technically bullish or bearish?

26-Aug-2025

As of August 25, 2025, the technical trend has shifted to a moderately strong bearish stance, indicated by bearish signals from MACD, moving averages, Bollinger Bands, KST, and OBV, along with significant underperformance compared to the Sensex.

As of 25 August 2025, the technical trend has changed from mildly bearish to bearish. The current stance is bearish with a moderate strength. Key indicators driving this include a bearish MACD on the weekly chart, a bearish moving average on the daily timeframe, and a bearish reading from Bollinger Bands on the monthly chart. Additionally, the KST and OBV both indicate bearish conditions on the monthly timeframe. The stock has underperformed significantly compared to the Sensex over multiple periods, further supporting the bearish outlook.

View full answer

Who are the top shareholders of the Clean Science?

17-Jul-2025

The top shareholders of Clean Science include promoter Ashok Ramnarayan Boob with 12.8%, 16 mutual fund schemes holding 4.48%, 92 foreign institutional investors with 6.07%, and the highest public shareholder, Anantroop Financial Advisory Services Private Limited, at 3.92%. Individual investors collectively own 7.78% of the shares.

The top shareholders of Clean Science include the promoters, who hold the majority of the shares. The promoter with the highest holding is Ashok Ramnarayan Boob, owning 12.8% of the company. Additionally, there are 16 mutual fund schemes that collectively hold 4.48%, and 92 foreign institutional investors (FIIs) with a combined holding of 6.07%. The highest public shareholder is Anantroop Financial Advisory Services Private Limited, which holds 3.92%. Individual investors also have a notable stake, accounting for 7.78% of the shares.

View full answer

Is Clean Science overvalued or undervalued?

09-Jun-2025

As of September 17, 2021, Clean Science is considered overvalued with a PE ratio of 60.69, significantly higher than its peers, and despite a 12.71% return over the past year, it is trading at a premium compared to its earnings and growth potential.

As of 17 September 2021, the valuation grade for Clean Science has moved from does not qualify to very expensive, indicating a significant shift in its perceived value. The company is currently considered overvalued. Key ratios include a PE ratio of 60.69, an EV to EBITDA of 40.46, and a PEG ratio of 7.28, all of which suggest that the stock is trading at a premium compared to its earnings and growth potential.<BR><BR>In comparison to its peers, Clean Science's PE ratio is notably higher than Godrej Industries Ltd., which has a PE of 46.63 and is rated as attractive, and Deepak Nitrite Ltd., with a PE of 37.97 and also rated very expensive. This disparity highlights Clean Science's overvaluation relative to its industry peers. Additionally, while Clean Science has shown a 12.71% return over the past year, this is less impressive compared to the Sensex's 7.55% return, reinforcing the notion that the stock may not be justifiably priced at its current levels.

View full answer

When is the next results date for Clean Science?

06-Jun-2025

No Upcoming Board Meetings

iScoreScore
Click here to find our call on this stock
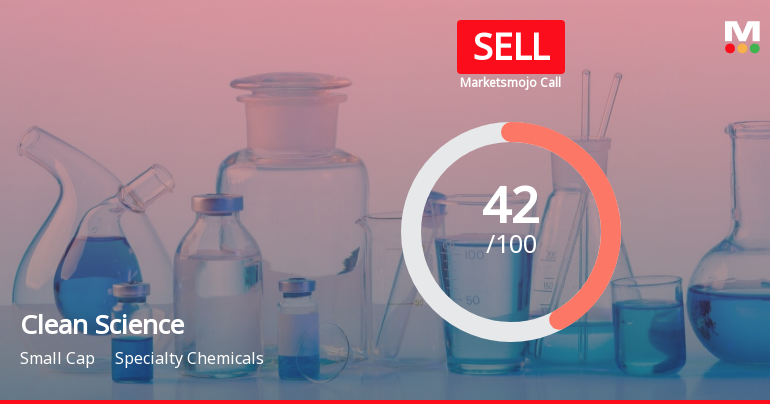
Strong Sell
Sell
Hold
Buy
Strong Buy

Dashboard

1

Poor long term growth as Net Sales has grown by an annual rate of 12.46% and Operating profit at 1.25% over the last 5 years

 
2

Flat results in Jun 26

3

With ROE of 14.5, it has a Very Expensive valuation with a 5.8 Price to Book Value

4

Consistent Underperformance against the benchmark over the last 3 years

stock-summaryMojo Parameters

Mojo Parameters

Loading Valuation Snapshot...

Stock DNA

stock-summary
Industry

Specialty Chemicals

stock-summary
Market cap

INR 9,109 Cr (Small Cap)

stock-summary
P/E

39.00

stock-summary
Industry P/E

43

stock-summary
Dividend Yield

0.70%

stock-summary
Debt Equity

-0.24

stock-summary
Return on Equity

14.50%

stock-summary
Price to Book

5.79

Revenue and Profits:
Net Sales:
268 Cr
(Quarterly Results - Jun 2026)
Net Profit:
73 Cr
stock-summaryTotal Returns
Total Returns (Price + Dividend) stock-summary
Dividend Yield (0.7%)
TimePeriod
Price Return
Dividend Return
Total Return
3 Months
8.0%
0.51%
8.51%
6 Months
15.46%
0.54%
16.0%
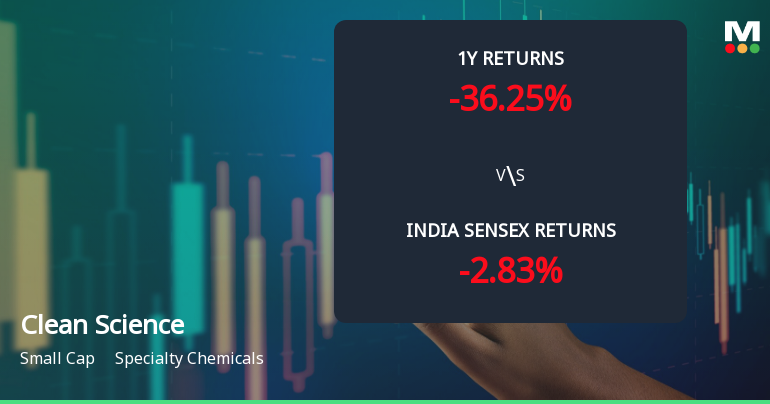
1 Year
-27.0%
0.50%
-26.5%
2 Years
-42.05%
0.76%
-41.29%
3 Years
-39.31%
0.97%
-38.34%
4 Years
-51.2%
1.08%
-50.12%
5 Years
-47.11%
1.11%
-46.0%

Latest dividend: 2 per share ex-dividend date: Feb-06-2026

Risk Adjusted Returns v/s stock-summary
Returns Beta
Icon
Beta has not been calculated since enough price history is not available
stock-summaryNews & Corporate Actions

Announcements stock-summary

Icon
No announcement available

Corporate Actions stock-summary

stock-summary
BOARD MEETING

No Upcoming Board Meetings

stock-summary
DIVIDEND

Clean Science & Technology Ltd has declared 400% dividend, ex-date: 04 Sep 26

stock-summary
SPLITS

No Splits history available

stock-summary
BONUS

No Bonus history available

stock-summary
RIGHTS

No Rights history available

stock-summaryKey Factors

Quality key factors stock-summary

Factor
Value
Sales Growth (5y)
12.46%
EBIT Growth (5y)
1.25%
EBIT to Interest (avg)
100.00
Debt to EBITDA (avg)
Net Debt is too low
Net Debt to Equity (avg)
-0.24
Sales to Capital Employed (avg)
0.77
Tax Ratio
25.50%
Dividend Payout Ratio
27.77%
Pledged Shares
0
Institutional Holding
29.61%
ROCE (avg)
42.12%
ROE (avg)
22.48%

Valuation key factors

Factor
Value
P/E Ratio
39
Industry P/E
43
Price to Book Value
5.79
EV to EBIT
32.39
EV to EBITDA
25.02
EV to Capital Employed
7.27
EV to Sales
8.96
PEG Ratio
NA
Dividend Yield
0.70%
ROCE (Latest)
22.92%
ROE (Latest)
14.50%

Technicals key factors

Indicator
Weekly
Monthly
MACD
Mildly Bullish
Bearish
RSI
No Signal
No Signal
Bollinger Bands
Bullish
Mildly Bearish
Moving Averages
Mildly Bearish (Daily)
KST
Bullish
Bearish
Dow Theory
Mildly Bullish
Mildly Bullish
OBV
Mildly Bullish
Mildly Bullish
stock-summary Technical Indicator Scale: Bearish, Mildly Bearish, Sideways, Mildly Bullish, Bullish  Turned 
stock-summaryShareholding
Shareholding Snapshot : Jun 2026stock-summary
Shareholding Compare (%holding) stock-summary
Majority shareholders

Promoters

Pledged Promoter Holdings

None

Mutual Funds

Held by 19 Schemes (12.0%)

FIIs

Held by 97 FIIs (13.37%)

Promoter with highest holding

Ashokkumar Ramkishan Sikchi Huf (9.96%)

Highest Public shareholder

Amansa Holdings Private Limited (4.37%)

Individual Investors Holdings

12.39%

stock-summaryFinancial
[
  {
    "link": "quarterly",
    "btn_text": "All Quarterly Results",
    "header": "Quarterly Results Snapshot (Consolidated) - Jun'26 - QoQ",
    "rhs": [
      {
        "prefix": "Net Sales ",
        "suffix": "QoQ Growth in quarter ended Jun 2026 is 7.70% vs 13.47% in Mar 2026",
        "dir": -1
      },
      {
        "prefix": "Consolidated Net Profit ",
        "suffix": "QoQ Growth in quarter ended Jun 2026 is 25.88% vs 27.01% in Mar 2026",
        "dir": -1
      }
    ],
    "table": {
      "header": [
        "Jun'26",
        "Mar'26",
        "Change(%)"
      ],
      "body": [
        {
          "field": "Net Sales",
          "val1": "268.43",
          "val2": "249.25",
          "chgp": "7.70%",
          "chgp_class": "positive"
        },
        {
          "field": "Operating Profit (PBDIT) excl Other Income",
          "val1": "96.43",
          "val2": "95.76",
          "chgp": "0.70%",
          "chgp_class": "positive"
        },
        {
          "field": "Interest",
          "val1": "0.05",
          "val2": "0.05",
          "chgp": "",
          "chgp_class": "neutral"
        },
        {
          "field": "Exceptional Items",
          "val1": "0.00",
          "val2": "0.00",
          "chgp": "",
          "chgp_class": "neutral"
        },
        {
          "field": "Consolidate Net Profit",
          "val1": "73.35",
          "val2": "58.27",
          "chgp": "25.88%",
          "chgp_class": "positive"
        },
        {
          "field": "Operating Profit Margin (Excl OI)",
          "val1": "35.92%",
          "val2": "38.42%",
          "chgp": "-2.50%",
          "chgp_class": "negative"
        }
      ]
    }
  },
  {
    "link": "half-yearly",
    "btn_text": "All Half Yearly Results",
    "header": "Half Yearly Results Snapshot (Consolidated) - Sep'25",
    "rhs": [
      {
        "prefix": "Net Sales ",
        "suffix": " Growth in half year ended Sep 2025 is 5.48% vs 25.17% in Sep 2024",
        "dir": -1
      },
      {
        "prefix": "Consolidated Net Profit ",
        "suffix": " Growth in half year ended Sep 2025 is 0.66% vs 12.19% in Sep 2024",
        "dir": -1
      }
    ],
    "table": {
      "header": [
        "Sep'25",
        "Sep'24",
        "Change(%)"
      ],
      "body": [
        {
          "field": "Net Sales",
          "val1": "487.47",
          "val2": "462.15",
          "chgp": "5.48%",
          "chgp_class": "positive"
        },
        {
          "field": "Operating Profit (PBDIT) excl Other Income",
          "val1": "186.94",
          "val2": "184.34",
          "chgp": "1.41%",
          "chgp_class": "positive"
        },
        {
          "field": "Interest",
          "val1": "0.14",
          "val2": "0.15",
          "chgp": "-6.67%",
          "chgp_class": "positive"
        },
        {
          "field": "Exceptional Items",
          "val1": "0.00",
          "val2": "0.00",
          "chgp": "",
          "chgp_class": "neutral"
        },
        {
          "field": "Consolidate Net Profit",
          "val1": "125.50",
          "val2": "124.68",
          "chgp": "0.66%",
          "chgp_class": "positive"
        },
        {
          "field": "Operating Profit Margin (Excl OI)",
          "val1": "38.35%",
          "val2": "39.89%",
          "chgp": "-1.54%",
          "chgp_class": "negative"
        }
      ]
    }
  },
  {
    "link": "nine-monthly",
    "btn_text": "All Nine Monthly Results",
    "header": "Nine Monthly Results Snapshot (Consolidated) - Dec'25",
    "rhs": [
      {
        "prefix": "Net Sales ",
        "suffix": "YoY Growth in nine months ended Dec 2025 is 0.59% vs 24.65% in Dec 2024",
        "dir": -1
      },
      {
        "prefix": "Consolidated Net Profit ",
        "suffix": "YoY Growth in nine months ended Dec 2025 is -9.95% vs 9.53% in Dec 2024",
        "dir": -1
      }
    ],
    "table": {
      "header": [
        "Dec'25",
        "Dec'24",
        "Change(%)"
      ],
      "body": [
        {
          "field": "Net Sales",
          "val1": "707.14",
          "val2": "702.97",
          "chgp": "0.59%",
          "chgp_class": "positive"
        },
        {
          "field": "Operating Profit (PBDIT) excl Other Income",
          "val1": "259.13",
          "val2": "282.84",
          "chgp": "-8.38%",
          "chgp_class": "negative"
        },
        {
          "field": "Interest",
          "val1": "0.31",
          "val2": "0.28",
          "chgp": "10.71%",
          "chgp_class": "negative"
        },
        {
          "field": "Exceptional Items",
          "val1": "0.00",
          "val2": "0.00",
          "chgp": "",
          "chgp_class": "neutral"
        },
        {
          "field": "Consolidate Net Profit",
          "val1": "171.38",
          "val2": "190.32",
          "chgp": "-9.95%",
          "chgp_class": "negative"
        },
        {
          "field": "Operating Profit Margin (Excl OI)",
          "val1": "36.64%",
          "val2": "40.24%",
          "chgp": "-3.60%",
          "chgp_class": "negative"
        }
      ]
    }
  },
  {
    "link": "annual",
    "btn_text": "All Annual Results",
    "header": "Annual Results Snapshot (Consolidated) - Mar'26",
    "rhs": [
      {
        "prefix": "Net Sales ",
        "suffix": "YoY Growth in year ended Mar 2026 is -1.04% vs 22.13% in Mar 2025",
        "dir": -1
      },
      {
        "prefix": "Consolidated Net Profit ",
        "suffix": "YoY Growth in year ended Mar 2026 is -13.14% vs 8.35% in Mar 2025",
        "dir": -1
      }
    ],
    "table": {
      "header": [
        "Mar'26",
        "Mar'25",
        "Change(%)"
      ],
      "body": [
        {
          "field": "Net Sales",
          "val1": "956.55",
          "val2": "966.64",
          "chgp": "-1.04%",
          "chgp_class": "negative"
        },
        {
          "field": "Operating Profit (PBDIT) excl Other Income",
          "val1": "355.05",
          "val2": "387.62",
          "chgp": "-8.40%",
          "chgp_class": "negative"
        },
        {
          "field": "Interest",
          "val1": "0.35",
          "val2": "0.42",
          "chgp": "-16.67%",
          "chgp_class": "positive"
        },
        {
          "field": "Exceptional Items",
          "val1": "0.00",
          "val2": "0.00",
          "chgp": "",
          "chgp_class": "neutral"
        },
        {
          "field": "Consolidate Net Profit",
          "val1": "229.66",
          "val2": "264.41",
          "chgp": "-13.14%",
          "chgp_class": "negative"
        },
        {
          "field": "Operating Profit Margin (Excl OI)",
          "val1": "37.12%",
          "val2": "40.10%",
          "chgp": "-2.98%",
          "chgp_class": "negative"
        }
      ]
    }
  }
]

Quarterly Results Snapshot (Consolidated) - Jun'26 - QoQstock-summary

Jun'26
Mar'26
Change(%)
Net Sales
268.43
249.25
7.70%
Operating Profit (PBDIT) excl Other Income
96.43
95.76
0.70%
Interest
0.05
0.05
Exceptional Items
0.00
0.00
Consolidate Net Profit
73.35
58.27
25.88%
Operating Profit Margin (Excl OI)
35.92%
38.42%
-2.50%
Values in Rs Cr.
Direction Arrows
Net Sales

QoQ Growth in quarter ended Jun 2026 is 7.70% vs 13.47% in Mar 2026

Direction Arrows
Consolidated Net Profit

QoQ Growth in quarter ended Jun 2026 is 25.88% vs 27.01% in Mar 2026

Half Yearly Results Snapshot (Consolidated) - Sep'25stock-summary

Sep'25
Sep'24
Change(%)
Net Sales
487.47
462.15
5.48%
Operating Profit (PBDIT) excl Other Income
186.94
184.34
1.41%
Interest
0.14
0.15
-6.67%
Exceptional Items
0.00
0.00
Consolidate Net Profit
125.50
124.68
0.66%
Operating Profit Margin (Excl OI)
38.35%
39.89%
-1.54%
Values in Rs Cr.
Direction Arrows
Net Sales

Growth in half year ended Sep 2025 is 5.48% vs 25.17% in Sep 2024

Direction Arrows
Consolidated Net Profit

Growth in half year ended Sep 2025 is 0.66% vs 12.19% in Sep 2024

Nine Monthly Results Snapshot (Consolidated) - Dec'25stock-summary

Dec'25
Dec'24
Change(%)
Net Sales
707.14
702.97
0.59%
Operating Profit (PBDIT) excl Other Income
259.13
282.84
-8.38%
Interest
0.31
0.28
10.71%
Exceptional Items
0.00
0.00
Consolidate Net Profit
171.38
190.32
-9.95%
Operating Profit Margin (Excl OI)
36.64%
40.24%
-3.60%
Values in Rs Cr.
Direction Arrows
Net Sales

YoY Growth in nine months ended Dec 2025 is 0.59% vs 24.65% in Dec 2024

Direction Arrows
Consolidated Net Profit

YoY Growth in nine months ended Dec 2025 is -9.95% vs 9.53% in Dec 2024

Annual Results Snapshot (Consolidated) - Mar'26stock-summary

Mar'26
Mar'25
Change(%)
Net Sales
956.55
966.64
-1.04%
Operating Profit (PBDIT) excl Other Income
355.05
387.62
-8.40%
Interest
0.35
0.42
-16.67%
Exceptional Items
0.00
0.00
Consolidate Net Profit
229.66
264.41
-13.14%
Operating Profit Margin (Excl OI)
37.12%
40.10%
-2.98%
Values in Rs Cr.
Direction Arrows
Net Sales

YoY Growth in year ended Mar 2026 is -1.04% vs 22.13% in Mar 2025

Direction Arrows
Consolidated Net Profit

YoY Growth in year ended Mar 2026 is -13.14% vs 8.35% in Mar 2025

stock-summaryCompany CV
About Clean Science & Technology Ltd stock-summary
stock-summary
Clean Science & Technology Ltd
Small Cap
Specialty Chemicals
Clean Science and Technology Limited was originally incorporated as 'Sri Distikemi Private Limited' on 07 November 2003 in Pune, Maharashtra as a Private Limited Company. Thereafter, name of the Company changed to `Clean Science and Technology Private Limited' on 31 July, 2006.
Company Coordinates stock-summary
Icon
No Company Details Available