
Compare Clean Science with Similar Stocks
Stock DNA
Specialty Chemicals
INR 7,992 Cr (Small Cap)
36.00
41
0.81%
-0.24
14.50%
4.97
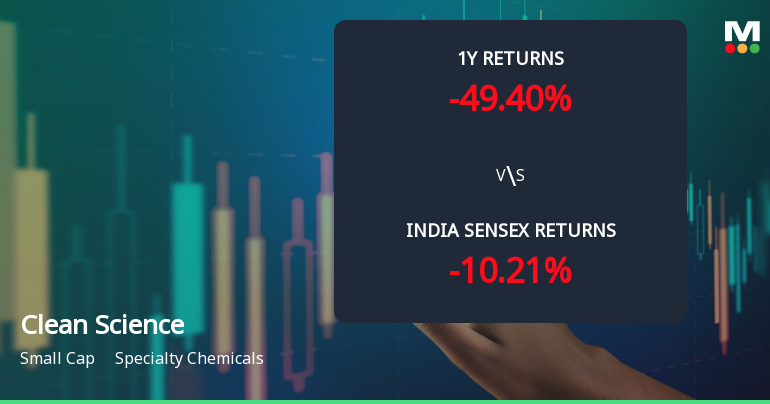
Total Returns (Price + Dividend) 
Latest dividend: 2 per share ex-dividend date: Feb-06-2026
Risk Adjusted Returns v/s
Returns Beta

News
Clean Science & Technology Ltd Faces Bearish Momentum Amid Technical Indicator Shifts
Clean Science & Technology Ltd, a small-cap player in the Specialty Chemicals sector, has experienced a notable shift in price momentum and technical indicators, signalling a bearish trend that has intensified over recent weeks. Despite some mildly bullish weekly signals, the overall technical landscape points to increased selling pressure and a deteriorating outlook for the stock.
Read full news article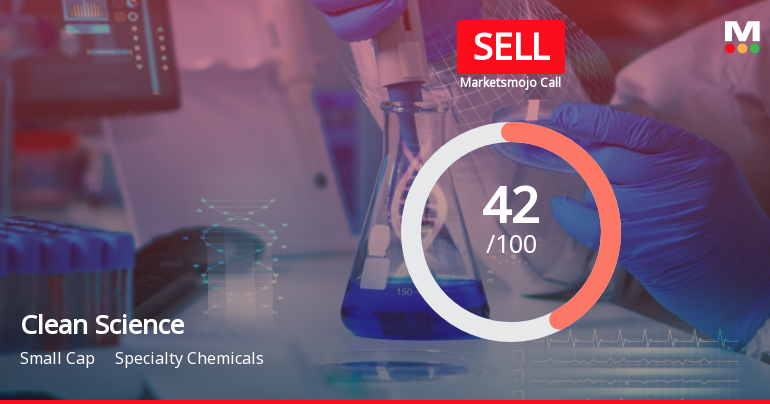
Clean Science & Technology Ltd is Rated Sell
Clean Science & Technology Ltd is rated Sell by MarketsMOJO, with this rating last updated on 15 Apr 2026. However, the analysis and financial metrics discussed here reflect the stock's current position as of 10 June 2026, providing investors with an up-to-date perspective on the company’s performance and outlook.
Read full news article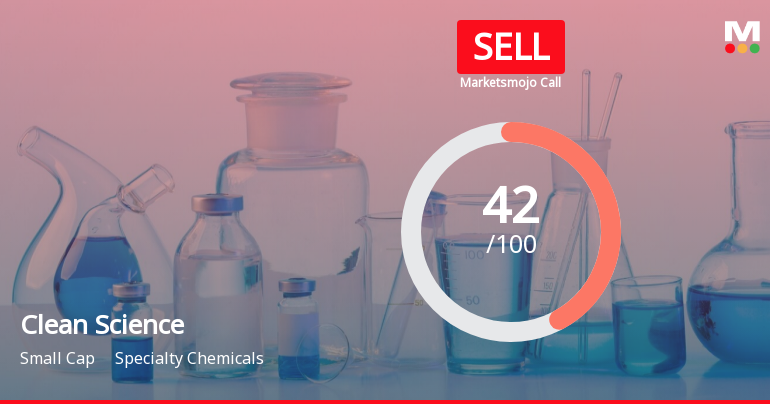
Clean Science & Technology Ltd is Rated Sell
Clean Science & Technology Ltd is rated 'Sell' by MarketsMOJO, with this rating last updated on 15 Apr 2026. However, the analysis and financial metrics discussed here reflect the stock's current position as of 30 May 2026, providing investors with an up-to-date view of its fundamentals, returns, and market standing.
Read full news article Announcements
Announcement under Regulation 30 (LODR)-Resignation of Director
11-Jun-2026 | Source : BSEEnclosed are the details of resignation of Mr. Sanjay Kothari (non-executive non-independent director)
Disclosures under Reg. 29(2) of SEBI (SAST) Regulations 2011
11-Jun-2026 | Source : BSEThe Exchange has received the disclosure under Regulation 29(2) of SEBI (Substantial Acquisition of Shares & Takeovers) Regulations 2011 for Asha Ashok Boob
Disclosures under Reg. 29(2) of SEBI (SAST) Regulations 2011
11-Jun-2026 | Source : BSEThe Exchange has received the disclosure under Regulation 29(2) of SEBI (Substantial Acquisition of Shares & Takeovers) Regulations 2011 for Nilima Boob
Corporate Actions

No Upcoming Board Meetings

Clean Science & Technology Ltd has declared 200% dividend, ex-date: 06 Feb 26

No Splits history available

No Bonus history available

No Rights history available
Quality key factors
Valuation key factors
Technicals key factors
 Technical Indicator Scale: Bearish, Mildly Bearish, Sideways, Mildly Bullish, Bullish Turned
 Shareholding Snapshot : Mar 2026
Shareholding Compare (%holding)
Promoters
0.6421
Held by 18 Schemes (12.49%)
Held by 101 FIIs (13.39%)
Ashokkumar Ramkishan Sikchi Huf (9.96%)
Amansa Holdings Private Limited (4.37%)
11.24%
Quarterly Results Snapshot (Consolidated) - Mar'26 - QoQ

QoQ Growth in quarter ended Mar 2026 is 13.47% vs -10.25% in Dec 2025
QoQ Growth in quarter ended Mar 2026 is 27.01% vs -17.23% in Dec 2025
Half Yearly Results Snapshot (Consolidated) - Sep'25

Growth in half year ended Sep 2025 is 5.48% vs 25.17% in Sep 2024
Growth in half year ended Sep 2025 is 0.66% vs 12.19% in Sep 2024
Nine Monthly Results Snapshot (Consolidated) - Dec'25
YoY Growth in nine months ended Dec 2025 is 0.59% vs 24.65% in Dec 2024
YoY Growth in nine months ended Dec 2025 is -9.95% vs 9.53% in Dec 2024
Annual Results Snapshot (Consolidated) - Mar'26
YoY Growth in year ended Mar 2026 is -1.04% vs 22.13% in Mar 2025
YoY Growth in year ended Mar 2026 is -13.14% vs 8.35% in Mar 2025
About Clean Science & Technology Ltd

Company Coordinates


