
Compare Clear Secure, Inc. with Similar Stocks
Dashboard
The company has declared Positive results for the last 10 consecutive quarters
- OPERATING CASH FLOW(Y) Highest at USD 322.07 MM
- ROCE(HY) Highest at 128.7%
- NET SALES(Q) Highest at USD 219.47 MM
With ROE of 199.24%, it has a fair valuation with a 29.84 Price to Book Value
Market Beating Performance
Total Returns (Price + Dividend) 
Clear Secure, Inc. for the last several years.
Risk Adjusted Returns v/s
News
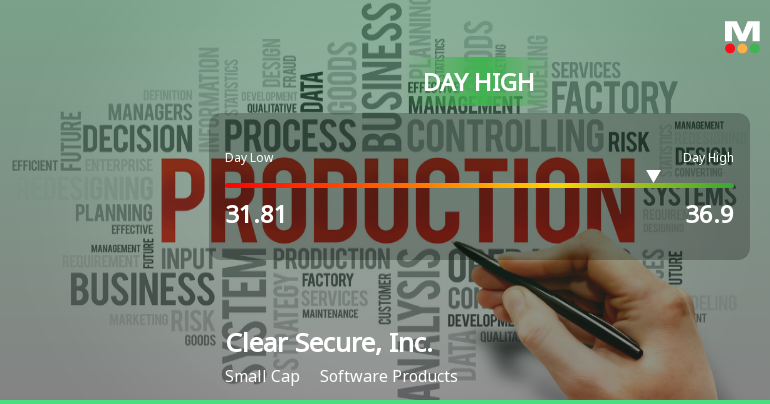
Clear Secure Stock Soars 12.68% to Intraday High of $36.90
Clear Secure, Inc. has shown remarkable performance, gaining 12.68% today and achieving an intraday high of USD 36.90. The company has consistently delivered positive results over the past ten quarters, with strong operational metrics and high institutional holdings, reflecting robust financial health and market confidence.
Read full news article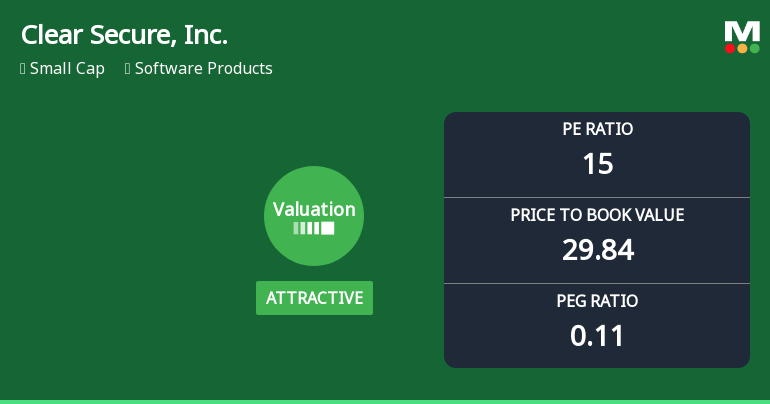
Clear Secure, Inc. Experiences Revision in Its Stock Evaluation Amid Strong Performance Metrics
Clear Secure, Inc., a small-cap software products company, has recently adjusted its valuation, with its stock price at $36.08. Over the past year, it has achieved a 26.46% return, surpassing the S&P 500. Key metrics include a P/E ratio of 15 and a high return on equity of 199.24%.
Read full news article Announcements

Corporate Actions
Quality key factors
Valuation key factors
Technicals key factors
 Technical Indicator Scale: Bearish, Mildly Bearish, Sideways, Mildly Bullish, Bullish Turned
 Shareholding Snapshot : Sep 2025
Shareholding Compare (%holding)
Domestic Funds
Held in 93 Schemes (57.79%)
Held by 137 Foreign Institutions (12.03%)
Quarterly Results Snapshot (Consolidated) - Sep'25 - YoY

YoY Growth in quarter ended Sep 2025 is 15.52% vs 23.69% in Sep 2024
YoY Growth in quarter ended Sep 2025 is 18.68% vs 41.26% in Sep 2024
Annual Results Snapshot (Consolidated) - Dec'24
YoY Growth in year ended Dec 2024 is 25.57% vs 40.28% in Dec 2023

YoY Growth in year ended Dec 2024 is 351.50% vs 143.24% in Dec 2023
About Clear Secure, Inc.

Company Coordinates


