
Compare CMS Info Systems with Similar Stocks
Dashboard
High Management Efficiency with a high ROE of 16.51%
The company is Net-Debt Free
Poor long term growth as Net Sales has grown by an annual rate of 11.84% and Operating profit at 5.98% over the last 5 years
Flat results in Mar 26
With ROE of 12.8, it has a Attractive valuation with a 2 Price to Book Value
High Institutional Holdings at 60.14%
Consistent Underperformance against the benchmark over the last 3 years
Stock DNA
Diversified Commercial Services
INR 4,777 Cr (Small Cap)
16.00
20
0.90%
-0.09
12.76%
2.03
Total Returns (Price + Dividend) 
Latest dividend: 2.6991563818153415 per share ex-dividend date: Feb-18-2026
Risk Adjusted Returns v/s
Returns Beta

News

CMS Info Systems Ltd is Rated Hold
CMS Info Systems Ltd is rated 'Hold' by MarketsMOJO, with this rating last updated on 15 June 2026. However, the analysis and financial metrics presented here reflect the stock's current position as of 22 June 2026, providing investors with the latest insights into its performance and outlook.
Read full news article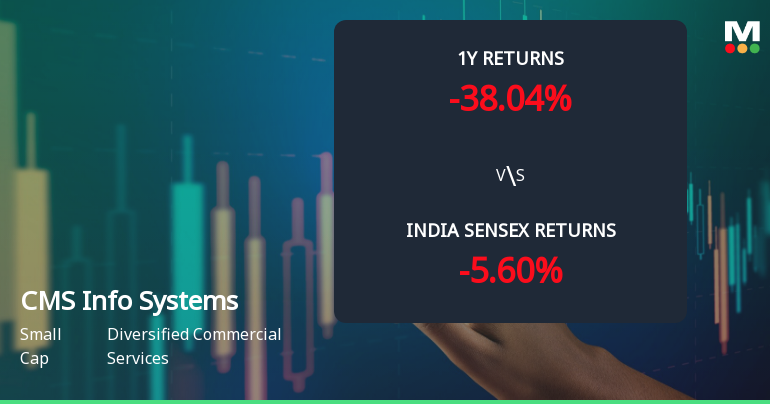
CMS Info Systems Ltd Technical Momentum Shifts Amid Mixed Market Signals
CMS Info Systems Ltd has experienced a nuanced shift in its technical parameters, reflecting a complex interplay of bullish and bearish signals across multiple timeframes. Despite a modest daily price gain of 1.55%, the stock’s broader momentum and technical indicators suggest a cautious outlook for investors navigating the diversified commercial services sector.
Read full news article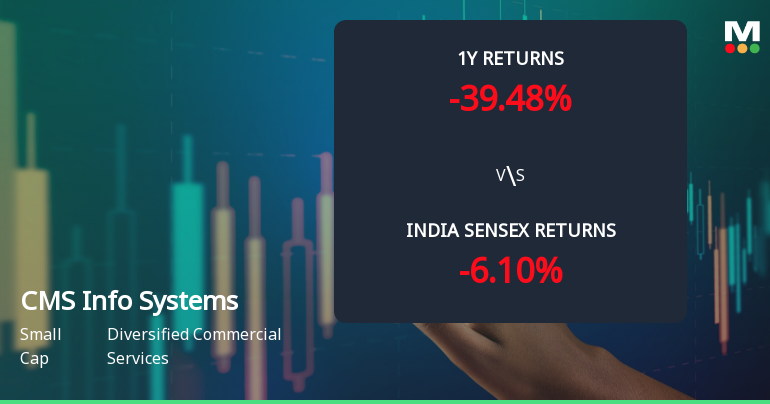
CMS Info Systems Ltd Technical Momentum Shifts Amid Bearish Signals
CMS Info Systems Ltd, a small-cap player in the Diversified Commercial Services sector, has experienced a notable shift in its technical momentum, moving from mildly bearish to a more pronounced bearish trend. Despite some mildly bullish weekly indicators, the overall technical landscape suggests caution for investors as the stock struggles to regain upward momentum amid broader market pressures.
Read full news article Announcements
Corporate Actions

No Upcoming Board Meetings

CMS Info Systems Ltd has declared 27% dividend, ex-date: 18 Feb 26

No Splits history available

No Bonus history available

No Rights history available
Quality key factors
Valuation key factors
Technicals key factors
 Technical Indicator Scale: Bearish, Mildly Bearish, Sideways, Mildly Bullish, Bullish Turned
 Shareholding Snapshot : Mar 2026
Shareholding Compare (%holding)
Non Institution
None
Held by 16 Schemes (29.14%)
Held by 153 FIIs (24.97%)
None
Sbi Small Cap Fund (9.11%)
25.6%
Quarterly Results Snapshot (Consolidated) - Mar'26 - QoQ

QoQ Growth in quarter ended Mar 2026 is 2.38% vs 1.58% in Dec 2025
QoQ Growth in quarter ended Mar 2026 is 37.74% vs -21.75% in Dec 2025
Half Yearly Results Snapshot (Consolidated) - Sep'25

Growth in half year ended Sep 2025 is 0.99% vs 15.98% in Sep 2024
Growth in half year ended Sep 2025 is -8.13% vs 7.74% in Sep 2024
Nine Monthly Results Snapshot (Consolidated) - Dec'25
YoY Growth in nine months ended Dec 2025 is 2.70% vs 10.25% in Dec 2024
YoY Growth in nine months ended Dec 2025 is -18.39% vs 7.50% in Dec 2024
Annual Results Snapshot (Consolidated) - Mar'26
YoY Growth in year ended Mar 2026 is 2.58% vs 7.06% in Mar 2025
YoY Growth in year ended Mar 2026 is -18.54% vs 7.29% in Mar 2025
About CMS Info Systems Ltd

Company Coordinates


