
Compare Coastal Corporat with Similar Stocks
Dashboard
Weak Long Term Fundamental Strength with an average Return on Capital Employed (ROCE) of 3.69%
- Poor long term growth as Operating profit has grown by an annual rate 15.24% of over the last 5 years
- Low ability to service debt as the company has a high Debt to EBITDA ratio of 7.95 times
With a growth in Operating Profit of 213.8%, the company declared Very Positive results in Mar 26
With ROCE of 6.4, it has a Attractive valuation with a 1 Enterprise value to Capital Employed
Majority shareholders : Non Institution
Market Beating Performance
Total Returns (Price + Dividend) 
Latest dividend: 1.2 per share ex-dividend date: Sep-20-2024
Risk Adjusted Returns v/s
Returns Beta

News
Coastal Corporation Ltd is Rated Hold
Coastal Corporation Ltd is rated 'Hold' by MarketsMOJO, with this rating last updated on 09 March 2026. However, the analysis and financial metrics discussed here reflect the company’s current position as of 11 June 2026, providing investors with an up-to-date view of its fundamentals, valuation, financial trends, and technical outlook.
Read full news articleAre Coastal Corporation Ltd latest results good or bad?
Coastal Corporation Ltd's latest financial results for Q4 FY26 present a complex picture of strong revenue growth juxtaposed with significant operational challenges. The company reported record-high revenue of ₹324.67 crores, reflecting a substantial year-on-year increase of 106.69% and a sequential growth of 7.28%. This impressive top-line performance is indicative of robust demand for its shrimp products in international markets. However, the underlying operational metrics reveal a concerning trend. The operating profit margin (excluding other income) declined to 4.97%, down from 5.66% in the previous quarter, highlighting pressures on profitability. This margin compression suggests that rising input costs or pricing challenges may be impacting the company's core operations. Additionally, while net profit reached ₹9.90 crores, the improvement was largely driven by a significant increase in other income, ...
Read full news article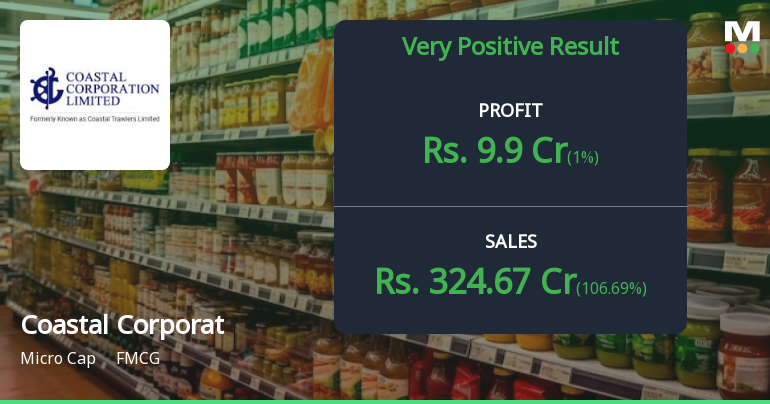
Coastal Corporation Q4 FY26: Revenue Surge Masks Margin Pressures
Coastal Corporation Ltd., a micro-cap shrimp exporter based in Visakhapatnam, reported a consolidated net profit of ₹9.90 crores for Q4 FY26, marking a sequential increase of 39.63% from ₹7.09 crores in Q3 FY26. However, the stock plunged 19.99% to ₹48.44 following the results announcement, reflecting investor concerns over deteriorating margins, elevated debt levels, and heavy reliance on non-operating income.
Read full news article Announcements
Announcement under Regulation 30 (LODR)-Newspaper Publication
01-Jun-2026 | Source : BSENewspaper publication of Audited Financial Results for the quarter and year ended 31.03.2026
Corporate Action-Board approves Dividend
30-May-2026 | Source : BSEBoard approves final dividend for the FY 2025-26
Submission Of Audited Financial Results For The Quarter And Year Ended 31.03.2026
30-May-2026 | Source : BSESubmission of audited financial results for the quarter and year ended 31.03.2026
Corporate Actions

No Upcoming Board Meetings

Coastal Corporation Ltd has declared 12% dividend, ex-date: 20 Sep 24

Coastal Corporation Ltd has announced 2:10 stock split, ex-date: 04 Mar 25

Coastal Corporation Ltd has announced 3:1 bonus issue, ex-date: 23 May 18

Coastal Corporation Ltd has announced 1:6 rights issue, ex-date: 25 Aug 22
Quality key factors
Valuation key factors
Technicals key factors
 Technical Indicator Scale: Bearish, Mildly Bearish, Sideways, Mildly Bullish, Bullish Turned
 Shareholding Snapshot : Mar 2026
Shareholding Compare (%holding)
Non Institution
None
Held by 0 Schemes
Held by 5 FIIs (1.04%)
Thottoli Valsaraj (12.17%)
Pinakin Chimanlal Shah (2.56%)
40.43%
Quarterly Results Snapshot (Consolidated) - Mar'26 - YoY

YoY Growth in quarter ended Mar 2026 is 106.69% vs 34.69% in Mar 2025
YoY Growth in quarter ended Mar 2026 is 1,061.17% vs 83.36% in Mar 2025
Half Yearly Results Snapshot (Consolidated) - Sep'25

Growth in half year ended Sep 2025 is 19.39% vs 35.69% in Sep 2024
Growth in half year ended Sep 2025 is 164.61% vs -54.18% in Sep 2024
Nine Monthly Results Snapshot (Consolidated) - Dec'25
YoY Growth in nine months ended Dec 2025 is 37.11% vs 47.72% in Dec 2024
YoY Growth in nine months ended Dec 2025 is 199.64% vs -48.55% in Dec 2024
Annual Results Snapshot (Consolidated) - Mar'26
YoY Growth in year ended Mar 2026 is 54.51% vs 44.23% in Mar 2025
YoY Growth in year ended Mar 2026 is 495.09% vs -0.88% in Mar 2025
About Coastal Corporation Ltd

Company Coordinates


