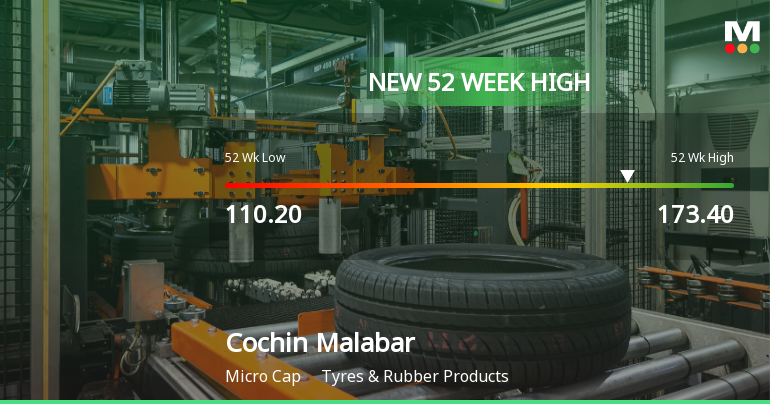
Cochin Malabar

  • Market Cap: Micro Cap
  • Industry: Tyres & Rubber Products
  • ISIN: INE788M01017
  • NSEID:
  • BSEID: 508571
INR
135.90
2.9 (2.18%)
BSENSE

Jul 06, 03:30 PM

BSE+NSE Vol: 43

  • Price Points
  • Score
  • Mojo Parameters
  • Total Return
  • News and Corporate Actions
  • Key factors
  • Shareholding
  • Financials
  • CompanyCV
stock-summaryPrice Point
High/Low

1Day

52 Week

Valuation
Technical
Day's Volume

CASH

43 (-31.53%) Volume

Shareholding (Mar 2026)

FII

0.00%

Held by 0 FIIs

DII

17.09%

Held by 1 DIIs

Promoter

62.72%

Why is Cochin Malabar Estates & Industries Ltd falling/rising?

07-Jul-2026

As of 06-Jul, Cochin Malabar Estates & Industries Ltd's stock price has risen to 135.90, marking a 2.18% increase after a seven-day decline. However, it remains below key moving averages and has underperformed its sector, with significantly reduced investor participation.

As of 06-Jul, Cochin Malabar Estates & Industries Ltd is experiencing a rise in its stock price, currently at 135.90, which reflects an increase of 2.9 or 2.18%. This upward movement follows a trend reversal after seven consecutive days of decline. The stock opened with a gain of 2.86% today and reached an intraday high of Rs 136.8. <BR><BR>Despite this positive movement today, the stock has underperformed compared to its sector, lagging by 2.94%. Additionally, it is trading below its 5-day, 20-day, 50-day, 100-day, and 200-day moving averages, indicating a longer-term downward trend. Furthermore, investor participation has significantly decreased, with delivery volume dropping by 98.57% against the 5-day average on July 3rd. <BR><BR>Overall, while the stock is currently rising, it is important to note the context of its recent performance and the broader market conditions, including the rubber products sector gaining by 5.2%.

View full answer

How big is Cochin Malabar?

11-Jun-2026

Summary could not be generated.

As of 10th June, <BR><BR>Market Cap: Cochin Malabar Estates & Industries Ltd has a market capitalization of 24.00 Cr, classified as a Micro Cap.<BR><BR>Recent Quarterly Performance: The sum of Net Sales for the latest 4 quarters is 0.00 Cr, while the sum of Net Profit for the same period reflects a loss of 0.45 Cr.<BR><BR>Balance Sheet Snapshot: The reporting period is the latest annual period, but data for Shareholder's Funds and Total Assets is unavailable.

View full answer

Who are in the management team of Cochin Malabar?

11-Jun-2026

The management team of Cochin Malabar includes C P Sharma (Whole-time Director), Tara Purohit and Jay Kumar Surana (Independent Directors), Hemant Bangur (Director), and Mohit Kandoi (Company Secretary & Compliance Officer).

The management team of Cochin Malabar includes the following individuals:<BR><BR>1. **C P Sharma** - Whole-time Director<BR>2. **Tara Purohit** - Independent Director<BR>3. **Hemant Bangur** - Director<BR>4. **Mohit Kandoi** - Company Secretary & Compliance Officer<BR>5. **Jay Kumar Surana** - Independent Director<BR><BR>If you need more information about their roles or the company, feel free to ask!

View full answer

Who are the peers of the Cochin Malabar?

11-Jun-2026

The peers of Cochin Malabar include Indag Rubber, Dolfin Rubbers, Tirupati Innovar, M M Rubber, Vamshi Rubber, Eastern Treads, Viaz Tyres, and Emerald Tyre. Viaz Tyres shows excellent management and growth, while Indag Rubber has the highest 1-year return among peers at -42.26%.

Peers: The peers of Cochin Malabar are Indag Rubber, Dolfin Rubbers, Tirupati Innovar, M M Rubber, Vamshi Rubber, Eastern Treads, Viaz Tyres, and Emerald Tyre.<BR><BR>Quality Snapshot: Excellent management risk is observed at Viaz Tyres, while Average management risk is found at Indag Rubber, Dolfin Rubbers, M M Rubber, and Emerald Tyre, and the rest. Below Average management risk is present at Tirupati Innovar and Vamshi Rubber. Growth is Excellent at Viaz Tyres, Average at Tirupati Innovar, and Below Average at Indag Rubber, Dolfin Rubbers, M M Rubber, Vamshi Rubber, and Emerald Tyre, and the rest. Capital Structure is Good at Indag Rubber, Dolfin Rubbers, and Tirupati Innovar, while Below Average is noted at M M Rubber, Vamshi Rubber, and Emerald Tyre, and the rest.<BR><BR>Return Snapshot: Indag Rubber has the highest 1-year return at -42.26%, while Vamshi Rubber has the lowest at -36.32%, with Cochin Malabar's own 1-year return at -20.80% being better than both. Additionally, peers such as M M Rubber, Vamshi Rubber, Eastern Treads, and Emerald Tyre have negative six-month returns.

View full answer

What does Cochin Malabar do?

10-Jun-2026

Cochin Malabar Estates & Industries Ltd is a micro-cap plantation company focused on rubber and tea in Kerala and Karnataka, with a market cap of INR 24 Cr and a recent net profit of 0 Cr as of March 2026. The company has a return on equity of 21.80% and operates with a negative debt-equity ratio of -1.73.

Overview: <BR>Cochin Malabar Estates & Industries Ltd is a plantation company engaged in rubber and tea plantations, operating within the Tyres & Rubber Products industry and classified as a Micro Cap.<BR><BR>History: <BR>The company was incorporated on March 14, 1930, and has been involved in rubber and tea plantations in Kerala and Karnataka since its inception. The latest quarterly results reported are for March 2026, showing a net profit of 0 Cr.<BR><BR>Financial Snapshot: <BR>Most recent Net Sales: N/A <BR>Most recent Net Profit: 0 Cr (Quarterly Results - Mar 2026) <BR>Market-cap value: INR 24 Cr (Micro Cap)<BR><BR>Key Metrics: <BR>P/E: N/A <BR>Industry P/E: 63 <BR>Dividend Yield: 0.00% <BR>Debt Equity: -1.73 <BR>Return on Equity: 21.80% <BR>Price to Book: -11.45<BR><BR>Contact Details: <BR>Address: 21 Strand Road, Kolkata, West Bengal: 700001 <BR>Phone: 91-033-22309601 <BR>Email: cochinmalabar@yahoo.com <BR>Website: http://www.cochinmalabar.in

View full answer

Are Cochin Malabar Estates & Industries Ltd latest results good or bad?

22-May-2026

Cochin Malabar Estates & Industries Ltd reported a net loss of ₹0.15 crore for Q1 2026, down from a profit of ₹1.73 crore last year, with net sales effectively at zero and a negative ROCE of 13.29%. The company's financial performance indicates a critical operational crisis and a bleak outlook without a turnaround strategy.

Cochin Malabar Estates & Industries Ltd's latest results are quite concerning. For the quarter ending March 2026, the company reported a net loss of ₹0.15 crore, which represents a significant decline from a profit of ₹1.73 crore in the same quarter last year. This marks a year-over-year change of -108.67%, indicating a deepening operational crisis.<BR><BR>The company has faced severe challenges, with net sales effectively at zero across recent quarters, leading to an operating loss of ₹0.31 crore. This situation reflects a complete cessation of revenue-generating activities, raising serious questions about the sustainability of its business model.<BR><BR>Additionally, the Return on Capital Employed (ROCE) stands at a negative 13.29%, highlighting ongoing capital destruction. The stock has also underperformed significantly, with a 1-year return of -22.67%, contrasting sharply with the broader Tyres & Rubber Products sector, which has seen positive returns.<BR><BR>Overall, the financial performance indicates a critical operational breakdown, and without a clear turnaround strategy, the outlook for Cochin Malabar appears bleak.

View full answer

Should I buy, sell or hold Cochin Malabar Estates & Industries Ltd?

22-May-2026

When is the next results date for Cochin Malabar Estates & Industries Ltd?

19-May-2026

The next results date for Cochin Malabar Estates & Industries Ltd is 21 May 2026.

The next results date for Cochin Malabar Estates & Industries Ltd is scheduled for 21 May 2026.

View full answer

How has been the historical performance of Cochin Malabar?

06-Nov-2025

Cochin Malabar has shown no revenue generation from Mar'18 to Mar'25, with net sales and operating income at zero. However, it reported a positive operating profit and profit after tax in Mar'25, indicating a recovery from previous losses, despite still having negative reserves.

Answer:<BR>The historical performance of Cochin Malabar shows a consistent lack of revenue generation over several years, with net sales and other operating income remaining at zero from Mar'18 to Mar'25. Total operating income also reflects this trend, remaining unchanged at zero during the same period. The company has incurred minimal employee costs, which increased slightly from 0.01 Cr in Mar'21 to 0.02 Cr in Mar'25, while manufacturing expenses have fluctuated slightly, peaking at 0.19 Cr in Mar'19. Total expenditure, excluding depreciation, has varied, with a notable increase to 0.18 Cr in Mar'25 from 0.11 Cr in Mar'24.<BR><BR>Operating profit (PBDIT) has shown a negative trend, with losses decreasing from -0.20 Cr in Mar'19 to -0.18 Cr in Mar'25, although the company reported a positive operating profit of 1.20 Cr in Mar'25, largely due to other income. Profit before tax has improved significantly, reaching 0.72 Cr in Mar'25, compared to a loss of -0.65 Cr in Mar'23. Profit after tax also turned positive, amounting to 1.28 Cr in Mar'25, a significant recovery from losses in previous years. The earnings per share (EPS) reflect this positive trend, increasing to 7.23 in Mar'25 from -3.67 in Mar'23. Despite these improvements, the company continues to show negative reserves, although they have improved from -5.20 Cr in Mar'23 to -3.42 Cr in Mar'25.<BR><BR>Breakdown:<BR>Cochin Malabar's financial performance over the years has been characterized by zero net sales and operating income from Mar'18 to Mar'25, indicating no revenue generation. Employee costs have seen a slight increase, while manufacturing expenses peaked in Mar'19. Total expenditure has fluctuated, with a recent increase noted in Mar'25. The operating profit has transitioned from negative figures to a positive outcome in Mar'25, driven by other income. Profit before tax has also shown significant improvement, turning positive in Mar'25, alongside a notable profit after tax. The earnings per share have rebounded, reflecting a recovery from previous losses, though the company still carries negative reserves, albeit improved from prior years.

View full answer

Who are the top shareholders of the Cochin Malabar?

17-Jul-2025

The top shareholders of Cochin Malabar are Shri Vasuprada Plantations Limited with 24.68%, followed by the Life Insurance Corporation of India at 16.77%, and individual investors holding 18.97%. There are no pledged promoter holdings, and the company has no mutual funds or foreign institutional investors.

The top shareholders of Cochin Malabar include Shri Vasuprada Plantations Limited, which holds the largest stake at 24.68%. Following that, the Life Insurance Corporation of India is the highest public shareholder with a 16.77% stake. Additionally, individual investors collectively hold 18.97% of the shares. Notably, there are no pledged promoter holdings, and the company does not have any mutual funds or foreign institutional investors currently holding shares.

View full answer

Is Cochin Malabar overvalued or undervalued?

09-Jun-2025

As of April 25, 2023, Cochin Malabar is rated as risky and overvalued, with a PE ratio of 25.35, negative EV to EBIT of -35.51, and a year-to-date performance of -7.01%, indicating concerns about profitability and growth compared to its peers.

As of 25 April 2023, the valuation grade for Cochin Malabar has moved from does not qualify to risky. The company is currently assessed as overvalued. Key ratios include a PE ratio of 25.35, an EV to EBIT of -35.51, and a PEG ratio of 0.16, which indicates potential concerns regarding profitability and growth prospects.<BR><BR>In comparison to its peers, Cochin Malabar's PE ratio is significantly lower than Cupid's 70.91, which is categorized as very expensive, and higher than Pix Transmission's 19.3, which is considered expensive. The negative price-to-book value of -19.66 and a return on capital employed (ROCE) of -14.79% further reinforce the notion of overvaluation. Additionally, while the stock has shown a 1-week return of 1.64% compared to the Sensex's 1.42%, its year-to-date performance of -7.01% against the Sensex's 5.62% highlights ongoing challenges.

View full answer

What is the technical trend for Cochin Malabar?

09-Jun-2025

As of June 5, 2025, Cochin Malabar's trend is mildly bearish, influenced by daily moving averages and a mildly bearish monthly MACD, despite mixed signals from the weekly MACD and Bollinger Bands.

As of 5 June 2025, the technical trend for Cochin Malabar has changed from sideways to mildly bearish. The weekly MACD is bullish, but the monthly MACD is mildly bearish, indicating mixed signals across time frames. The daily moving averages are mildly bearish, reinforcing the current negative sentiment. The Bollinger Bands show a mildly bullish stance on both weekly and monthly charts, which contrasts with the overall bearish trend. The KST is mildly bullish on the weekly but mildly bearish on the monthly, adding to the mixed outlook. Overall, the current stance is mildly bearish, driven primarily by the daily moving averages and the monthly MACD.

View full answer

Has Cochin Malabar declared dividend?

06-Jun-2025

No Dividend History Available

iScoreScore
Click here to find our call on this stock
Strong Sell
Sell
Hold
Buy
Strong Buy

Dashboard

1

With a Negative Book Value, the company has a Weak Long Term Fundamental Strength

  • Poor long term growth as Net Sales has grown by an annual rate of % and Operating profit at 0% over the last 5 years
  • The company has a negative book value of Rs 2.11 crore
2

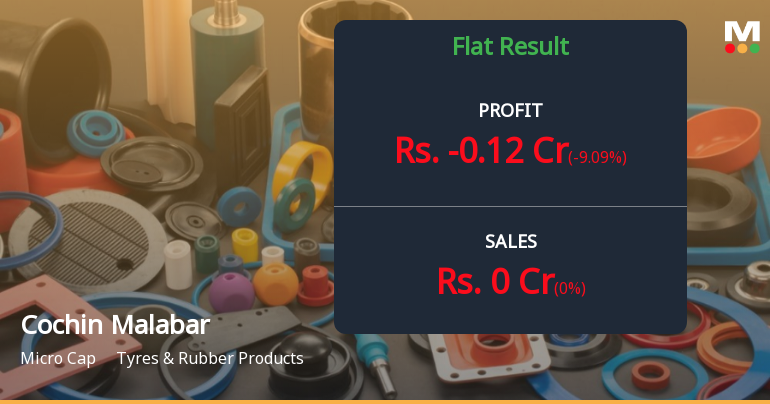
Flat results in Mar 26

3

Risky - Negative EBITDA

4

Below par performance in long term as well as near term

stock-summaryMojo Parameters

Mojo Parameters

Loading Valuation Snapshot...

Stock DNA

stock-summary
Industry

Tyres & Rubber Products

stock-summary
Market cap

INR 24 Cr (Micro Cap)

stock-summary
P/E

NA (Loss Making)

stock-summary
Industry P/E

78

stock-summary
Dividend Yield

0.00%

stock-summary
Debt Equity

-1.73

stock-summary
Return on Equity

21.80%

stock-summary
Price to Book

-11.17

Revenue and Profits:
Net Sales:
(Quarterly Results - Mar 2026)
Net Profit:
0 Cr
stock-summaryTotal Returns
Total Returns (Price + Dividend) stock-summary
Dividend Yield (0%)
TimePeriod
Price Return
Dividend Return
Total Return
3 Months
4.54%
0%
4.54%
6 Months
-6.63%
0%
-6.63%
1 Year
-24.01%
0%
-24.01%
2 Years
-31.14%
0%
-31.14%
3 Years
36.31%
0%
36.31%
4 Years
66.75%
0%
66.75%
5 Years
0%
0%
0.0%

Cochin Malabar for the last several years.

Risk Adjusted Returns v/s stock-summary
Returns Beta
Icon
Beta has not been calculated since enough price history is not available
stock-summaryNews & Corporate Actions

News

Announcements stock-summary

Closure of Trading Window

23-Jun-2026 | Source : BSE

Intimation of Closure of Trading Window for the quarter ended 30th June 2026.

Announcement under Regulation 30 (LODR)-Change in Management

12-Jun-2026 | Source : BSE

Intimation under Regulation 30 of SEBI (LODR) Regulations 2015 - Re-appointment of Wholetime Director of the Company.

Announcement under Regulation 30 (LODR)-Newspaper Publication

22-May-2026 | Source : BSE

Submission of Newspaper Advertisement of Audited Financial Results of the Company for the quarter and year ended 31st March 2026.

Corporate Actions stock-summary

stock-summary
BOARD MEETING

No Upcoming Board Meetings

stock-summary
DIVIDEND

No Dividend history available

stock-summary
SPLITS

No Splits history available

stock-summary
BONUS

No Bonus history available

stock-summary
RIGHTS

No Rights history available

stock-summaryKey Factors

Quality key factors stock-summary

Factor
Value
Sales Growth (5y)
0.00%
EBIT Growth (5y)
-16.93%
EBIT to Interest (avg)
0
Debt to EBITDA (avg)
Negative Net Debt
Net Debt to Equity (avg)
-1.73
Sales to Capital Employed (avg)
0
Tax Ratio
Tax Ratio is Negative%
Dividend Payout Ratio
0
Pledged Shares
0
Institutional Holding
17.09%
ROCE (avg)
-17.18%
ROE (avg)
0

Valuation key factors

Factor
Value
P/E Ratio
NA (Loss Making)
Industry P/E
78
Price to Book Value
-11.41
EV to EBIT
-27.73
EV to EBITDA
-27.73
EV to Capital Employed
18.01
EV to Sales
NA
PEG Ratio
NA
Dividend Yield
NA
ROCE (Latest)
-29.22%
ROE (Latest)
Negative BV

Technicals key factors

Indicator
Weekly
Monthly
MACD
Mildly Bullish
Bearish
RSI
No Signal
No Signal
Bollinger Bands
Sideways
Mildly Bearish
Moving Averages
Bearish (Daily)
KST
Bullish
Bearish
Dow Theory
No Trend
Mildly Bullish
stock-summary Technical Indicator Scale: Bearish, Mildly Bearish, Sideways, Mildly Bullish, Bullish  Turned 
stock-summaryShareholding
Shareholding Snapshot : Mar 2026stock-summary
Shareholding Compare (%holding) stock-summary
Majority shareholders

Promoters

Pledged Promoter Holdings

None

Mutual Funds

Held by 0 Schemes

FIIs

Held by 0 FIIs

Promoter with highest holding

Shri Vasuprada Plantations Limited (24.68%)

Highest Public shareholder

Life Insurance Corporation Of India (16.77%)

Individual Investors Holdings

18.91%

stock-summaryFinancial
[
  {
    "link": "quarterly",
    "btn_text": "All Quarterly Results",
    "header": "Quarterly Results Snapshot (Standalone) - Mar'26 - YoY",
    "rhs": [
      {
        "prefix": "Net Sales ",
        "suffix": "YoY Growth in quarter ended Mar 2026 is 0.00% vs 0.00% in Mar 2025",
        "dir": 0
      },
      {
        "prefix": "Standalone Net Profit ",
        "suffix": "YoY Growth in quarter ended Mar 2026 is -108.67% vs 73.00% in Mar 2025",
        "dir": -1
      }
    ],
    "table": {
      "header": [
        "Mar'26",
        "Mar'25",
        "Change(%)"
      ],
      "body": [
        {
          "field": "Net Sales",
          "val1": "0.00",
          "val2": "0.00",
          "chgp": "",
          "chgp_class": "neutral"
        },
        {
          "field": "Operating Profit (PBDIT) excl Other Income",
          "val1": "-0.31",
          "val2": "-0.09",
          "chgp": "-244.44%",
          "chgp_class": "negative"
        },
        {
          "field": "Interest",
          "val1": "0.10",
          "val2": "0.11",
          "chgp": "-9.09%",
          "chgp_class": "positive"
        },
        {
          "field": "Exceptional Items",
          "val1": "0.00",
          "val2": "0.00",
          "chgp": "",
          "chgp_class": "neutral"
        },
        {
          "field": "Standalone Net Profit",
          "val1": "-0.15",
          "val2": "1.73",
          "chgp": "-108.67%",
          "chgp_class": "negative"
        },
        {
          "field": "Operating Profit Margin (Excl OI)",
          "val1": "0.00%",
          "val2": "0.00%",
          "chgp": "NA",
          "chgp_class": "neutral"
        }
      ]
    }
  },
  {
    "link": "half-yearly",
    "btn_text": "All Half Yearly Results",
    "header": "Half Yearly Results Snapshot (Standalone) - Sep'25",
    "rhs": [
      {
        "prefix": "Net Sales ",
        "suffix": " Growth in half year ended Sep 2025 is 0.00% vs 0.00% in Sep 2024",
        "dir": 0
      },
      {
        "prefix": "Standalone Net Profit ",
        "suffix": " Growth in half year ended Sep 2025 is 35.48% vs 11.43% in Sep 2024",
        "dir": 1
      }
    ],
    "table": {
      "header": [
        "Sep'25",
        "Sep'24",
        "Change(%)"
      ],
      "body": [
        {
          "field": "Net Sales",
          "val1": "0.00",
          "val2": "0.00",
          "chgp": "",
          "chgp_class": "neutral"
        },
        {
          "field": "Operating Profit (PBDIT) excl Other Income",
          "val1": "-0.07",
          "val2": "-0.08",
          "chgp": "12.50%",
          "chgp_class": "positive"
        },
        {
          "field": "Interest",
          "val1": "0.19",
          "val2": "0.23",
          "chgp": "-17.39%",
          "chgp_class": "positive"
        },
        {
          "field": "Exceptional Items",
          "val1": "0.00",
          "val2": "0.00",
          "chgp": "",
          "chgp_class": "neutral"
        },
        {
          "field": "Standalone Net Profit",
          "val1": "-0.20",
          "val2": "-0.31",
          "chgp": "35.48%",
          "chgp_class": "positive"
        },
        {
          "field": "Operating Profit Margin (Excl OI)",
          "val1": "0.00%",
          "val2": "0.00%",
          "chgp": "NA",
          "chgp_class": "neutral"
        }
      ]
    }
  },
  {
    "link": "nine-monthly",
    "btn_text": "All Nine Monthly Results",
    "header": "Nine Monthly Results Snapshot (Standalone) - Dec'25",
    "rhs": [
      {
        "prefix": "Net Sales ",
        "suffix": "YoY Growth in nine months ended Dec 2025 is 0.00% vs 0.00% in Dec 2024",
        "dir": 0
      },
      {
        "prefix": "Standalone Net Profit ",
        "suffix": "YoY Growth in nine months ended Dec 2025 is 33.33% vs 10.00% in Dec 2024",
        "dir": 1
      }
    ],
    "table": {
      "header": [
        "Dec'25",
        "Dec'24",
        "Change(%)"
      ],
      "body": [
        {
          "field": "Net Sales",
          "val1": "0.00",
          "val2": "0.00",
          "chgp": "",
          "chgp_class": "neutral"
        },
        {
          "field": "Operating Profit (PBDIT) excl Other Income",
          "val1": "-0.10",
          "val2": "-0.09",
          "chgp": "-11.11%",
          "chgp_class": "negative"
        },
        {
          "field": "Interest",
          "val1": "0.29",
          "val2": "0.35",
          "chgp": "-17.14%",
          "chgp_class": "positive"
        },
        {
          "field": "Exceptional Items",
          "val1": "0.00",
          "val2": "0.00",
          "chgp": "",
          "chgp_class": "neutral"
        },
        {
          "field": "Standalone Net Profit",
          "val1": "-0.30",
          "val2": "-0.45",
          "chgp": "33.33%",
          "chgp_class": "positive"
        },
        {
          "field": "Operating Profit Margin (Excl OI)",
          "val1": "0.00%",
          "val2": "0.00%",
          "chgp": "NA",
          "chgp_class": "neutral"
        }
      ]
    }
  },
  {
    "link": "annual",
    "btn_text": "All Annual Results",
    "header": "Annual Results Snapshot (Standalone) - Mar'26",
    "rhs": [
      {
        "prefix": "Net Sales ",
        "suffix": "YoY Growth in year ended Mar 2026 is 0.00% vs 0.00% in Mar 2025",
        "dir": 0
      },
      {
        "prefix": "Standalone Net Profit ",
        "suffix": "YoY Growth in year ended Mar 2026 is -135.94% vs 156.00% in Mar 2025",
        "dir": -1
      }
    ],
    "table": {
      "header": [
        "Mar'26",
        "Mar'25",
        "Change(%)"
      ],
      "body": [
        {
          "field": "Net Sales",
          "val1": "0.00",
          "val2": "0.00",
          "chgp": "",
          "chgp_class": "neutral"
        },
        {
          "field": "Operating Profit (PBDIT) excl Other Income",
          "val1": "-0.43",
          "val2": "-0.18",
          "chgp": "-138.89%",
          "chgp_class": "negative"
        },
        {
          "field": "Interest",
          "val1": "0.39",
          "val2": "0.45",
          "chgp": "-13.33%",
          "chgp_class": "positive"
        },
        {
          "field": "Exceptional Items",
          "val1": "0.00",
          "val2": "0.00",
          "chgp": "",
          "chgp_class": "neutral"
        },
        {
          "field": "Standalone Net Profit",
          "val1": "-0.46",
          "val2": "1.28",
          "chgp": "-135.94%",
          "chgp_class": "negative"
        },
        {
          "field": "Operating Profit Margin (Excl OI)",
          "val1": "0.00%",
          "val2": "0.00%",
          "chgp": "NA",
          "chgp_class": "neutral"
        }
      ]
    }
  }
]

Quarterly Results Snapshot (Standalone) - Mar'26 - YoYstock-summary

Mar'26
Mar'25
Change(%)
Net Sales
0.00
0.00
Operating Profit (PBDIT) excl Other Income
-0.31
-0.09
-244.44%
Interest
0.10
0.11
-9.09%
Exceptional Items
0.00
0.00
Standalone Net Profit
-0.15
1.73
-108.67%
Operating Profit Margin (Excl OI)
0.00%
0.00%
NA
Values in Rs Cr.
Net Sales

YoY Growth in quarter ended Mar 2026 is 0.00% vs 0.00% in Mar 2025

Direction Arrows
Standalone Net Profit

YoY Growth in quarter ended Mar 2026 is -108.67% vs 73.00% in Mar 2025

Half Yearly Results Snapshot (Standalone) - Sep'25stock-summary

Sep'25
Sep'24
Change(%)
Net Sales
0.00
0.00
Operating Profit (PBDIT) excl Other Income
-0.07
-0.08
12.50%
Interest
0.19
0.23
-17.39%
Exceptional Items
0.00
0.00
Standalone Net Profit
-0.20
-0.31
35.48%
Operating Profit Margin (Excl OI)
0.00%
0.00%
NA
Values in Rs Cr.
Net Sales

Growth in half year ended Sep 2025 is 0.00% vs 0.00% in Sep 2024

Direction Arrows
Standalone Net Profit

Growth in half year ended Sep 2025 is 35.48% vs 11.43% in Sep 2024

Nine Monthly Results Snapshot (Standalone) - Dec'25stock-summary

Dec'25
Dec'24
Change(%)
Net Sales
0.00
0.00
Operating Profit (PBDIT) excl Other Income
-0.10
-0.09
-11.11%
Interest
0.29
0.35
-17.14%
Exceptional Items
0.00
0.00
Standalone Net Profit
-0.30
-0.45
33.33%
Operating Profit Margin (Excl OI)
0.00%
0.00%
NA
Values in Rs Cr.
Net Sales

YoY Growth in nine months ended Dec 2025 is 0.00% vs 0.00% in Dec 2024

Direction Arrows
Standalone Net Profit

YoY Growth in nine months ended Dec 2025 is 33.33% vs 10.00% in Dec 2024

Annual Results Snapshot (Standalone) - Mar'26stock-summary

Mar'26
Mar'25
Change(%)
Net Sales
0.00
0.00
Operating Profit (PBDIT) excl Other Income
-0.43
-0.18
-138.89%
Interest
0.39
0.45
-13.33%
Exceptional Items
0.00
0.00
Standalone Net Profit
-0.46
1.28
-135.94%
Operating Profit Margin (Excl OI)
0.00%
0.00%
NA
Values in Rs Cr.
Net Sales

YoY Growth in year ended Mar 2026 is 0.00% vs 0.00% in Mar 2025

Direction Arrows
Standalone Net Profit

YoY Growth in year ended Mar 2026 is -135.94% vs 156.00% in Mar 2025

stock-summaryCompany CV
About Cochin Malabar Estates & Industries Ltd stock-summary
stock-summary
Cochin Malabar Estates & Industries Ltd
Micro Cap
Tyres & Rubber Products
The Cochin Malabar Estates and Industries Limited was incorporated on March 14, 1930 and has been presently carrying on the business of rubber and tea plantations in the State of Kerala and Karnataka since then. The Company is basically a plantation company with 3 Rubber Estates in Kerala. The Company had purchased one Tea Estate in Idukki Dist., Kerala; which was fully uprooted in a phased manner and replanted with high yield varieties.
Company Coordinates stock-summary
Company Details
21 Strand Road , Kolkata West Bengal : 700001
stock-summary
Tel: 91-033-22309601
stock-summary
cochinmalabar@yahoo.com
Registrar Details
Maheshwari Datamatics Pvt Ltd , 6 Mangoe Lane , 2nd Floor, Calcutta