Coffee Day Enter

  • Market Cap: Micro Cap
  • Industry: Leisure Services
  • ISIN: INE335K01011
  • NSEID: COFFEEDAY
  • BSEID: 539436
INR
34.01
-0.95 (-2.72%)
BSENSE

Jun 12, 03:30 PM

BSE+NSE Vol: 10.09 lacs

  • Price Points
  • Score
  • Mojo Parameters
  • Total Return
  • News and Corporate Actions
  • Key factors
  • Shareholding
  • Financials
  • CompanyCV
stock-summaryPrice Point
High/Low

1Day

52 Week

Valuation
Technical
Day's Volume

CASH

10.09 lacs (-42.77%) Volume

Shareholding (Mar 2026)

FII

0.85%

Held by 12 FIIs

DII

2.38%

Held by 1 DIIs

Promoter

7.83%

Why is Coffee Day Enterprises Ltd falling/rising?

12-Jun-2026

As of 11-Jun, Coffee Day Enterprises Ltd's stock price is rising to Rs 34.96, recovering from previous declines and outperforming its sector by 5.65%. However, high volatility and a significant drop in delivery volume suggest declining investor participation.

As of 11-Jun, Coffee Day Enterprises Ltd's stock price is rising, currently at Rs 34.96, with a change of Rs 1.58, or 4.73%. This increase follows a trend reversal after four consecutive days of decline. Despite opening the day with a loss of 4.73%, the stock managed to reach an intraday high of Rs 35.04, indicating a recovery during the trading session. <BR><BR>The stock has outperformed its sector by 5.65% today, suggesting a positive shift in investor sentiment. However, it is important to note that the stock has experienced high volatility, with an intraday volatility of 5.61%. This volatility, combined with a significant drop in delivery volume—down 86.9% compared to the five-day average—indicates that while the stock is currently rising, investor participation is declining.<BR><BR>Overall, the stock's rise today can be attributed to a recovery from previous losses and positive performance relative to its sector, despite the challenges of high volatility and reduced investor participation.

View full answer

How big is Coffee Day Enter?

11-Jun-2026

As of 10th June, Coffee Day Enterprises Ltd has a market capitalization of 720.00 Cr, with recent net sales of 1115.75 Cr and a net profit of 203.08 Cr. Shareholder's funds are 2,590.46 Cr, and total assets amount to 4,641.23 Cr.

As of 10th June, Coffee Day Enterprises Ltd has a market capitalization of 720.00 Cr, classified as a Micro Cap.<BR><BR>In the latest four quarters, the company reported Net Sales of 1115.75 Cr and a Net Profit of 203.08 Cr.<BR><BR>The latest annual period for the balance sheet is March 2025, with Shareholder's Funds amounting to 2,590.46 Cr and Total Assets totaling 4,641.23 Cr.

View full answer

Who are in the management team of Coffee Day Enter?

11-Jun-2026

The management team of Coffee Day Enter includes S V Ranganath (Interim Chairman), Malavika Hedge (Whole Time Director & CEO), K.R. Mohan, Vasundhara Devi, and GIRI DEVANUR (all Independent Directors), and Indupura Renuka Ravish (Non-Executive Director).

The management team of Coffee Day Enter includes the following individuals:<BR><BR>1. **S V Ranganath** - Interim Chairman<BR>2. **Malavika Hedge** - Whole Time Director & CEO<BR>3. **K.R. Mohan** - Independent Non-Executive Director<BR>4. **Vasundhara Devi** - Independent Director<BR>5. **GIRI DEVANUR** - Independent Non-Executive Director<BR>6. **Indupura Renuka Ravish** - Non-Executive Director<BR><BR>If you need more details about any specific member or their roles, feel free to ask!

View full answer

Should I buy, sell or hold Coffee Day Enterprises Ltd?

11-Jun-2026

Who are the peers of the Coffee Day Enter?

11-Jun-2026

Peers of Coffee Day Enter include Restaurant Brand, Wonderla Holiday, Imagica. Enter., United Foodbrand, Delta Corp, Speciality Rest., Kaya Ltd, Nicco Parks, and Gourmet Gateway. United Foodbrand shows the highest 1-year return at 69.67%, while Coffee Day Enter has a return of -9.12%.

Peers: The peers of Coffee Day Enter are Restaurant Brand, Wonderla Holiday, Imagica. Enter., United Foodbrand, Delta Corp, Speciality Rest., Kaya Ltd, Nicco Parks, and Gourmet Gateway.<BR><BR>Quality Snapshot: Excellent management risk is observed at United Foodbrand and Nicco Parks, while Average management risk is found at Wonderla Holiday, Delta Corp, and Speciality Rest., and the rest have Below Average management risk. Good growth is noted at Wonderla Holiday and Nicco Parks, Average growth is seen at Delta Corp, Speciality Rest., and Imagica. Enter., while the rest have Below Average growth. Excellent capital structure is present at Wonderla Holiday, Delta Corp, and Nicco Parks, while Good capital structure is noted at Speciality Rest., and the rest have Below Average capital structure.<BR><BR>Return Snapshot: United Foodbrand has the highest 1-year return at 69.67%, while Imagica. Enter. has the lowest at -42.61%. Coffee Day Enter's 1-year return of -9.12% is better than Imagica. Enter. but worse than United Foodbrand. Additionally, the six-month return is negative for Restaurant Brand, Wonderla Holiday, Delta Corp, Kaya Ltd, and Nicco Parks.

View full answer

What does Coffee Day Enter do?

10-Jun-2026

Coffee Day Enterprises Ltd operates in the leisure services industry, primarily known for its coffee retail business. As of March 2026, it reported net sales of 281 Cr and a net profit of 132 Cr, with a market cap of INR 720 Cr.

Overview:<BR>Coffee Day Enterprises Ltd operates in the leisure services industry and is categorized as a micro-cap company.<BR><BR>History:<BR>The company was originally formed as a Partnership Firm on February 1, 2008, under the name Coffeeday Holding Co. It was later converted into a Private Limited Company as Coffee Day Holdings Company Private Limited, with a fresh Certificate of Incorporation issued on June 20, 2008. The latest quarterly results reported net sales and net profit for the period ending March 2026.<BR><BR>Financial Snapshot:<BR>- Net Sales: 281 Cr (Quarterly Results - Mar 2026)<BR>- Net Profit: 132 Cr (Quarterly Results - Mar 2026)<BR>- Market Cap: INR 720 Cr (Micro Cap)<BR><BR>Key Metrics:<BR>- P/E: N/A<BR>- Industry P/E: 42<BR>- Dividend Yield: 0.00%<BR>- Debt Equity: 0.29<BR>- Return on Equity: -0.97%<BR>- Price to Book: 0.26<BR><BR>Contact Details:<BR>Address: 23/2 Coffee Day Square, Vittal Mallya Road Bangaluru Karnataka : 560001<BR>Tel: 91-80-40012345<BR>Email: investor@coffeeday.com<BR>Website: http://www.coffeeday.com

View full answer

Are Coffee Day Enterprises Ltd latest results good or bad?

29-May-2026

Coffee Day Enterprises Ltd's latest results show a net profit increase of 138.81% quarter-on-quarter, but this is driven by exceptional items and a low tax rate, raising concerns about sustainability. Revenue declined slightly sequentially and the company faces ongoing challenges with negative return on equity, indicating underlying operational weaknesses.

Coffee Day Enterprises Ltd's latest results present a mixed picture. While the company reported a consolidated net profit of ₹132.06 crores for Q4 FY26, reflecting a significant 138.81% increase quarter-on-quarter, this profit surge is primarily driven by exceptional items and a notably low effective tax rate of just 5.75%. This raises concerns about the sustainability of the reported earnings, as they do not stem from core operational improvements.<BR><BR>On the revenue front, net sales for the quarter were ₹280.51 crores, which is a 2.05% decline sequentially but a modest 4.66% increase year-on-year. This suggests stagnation in demand, as the year-on-year growth barely keeps pace with inflation. The operating profit margin, excluding other income, improved to 18.09%, marking the highest margin in recent quarters, but the overall structural profitability remains questionable given the company's long-term performance metrics.<BR><BR>Furthermore, the company's return on equity (ROE) stands at a deeply negative -4.24%, indicating ongoing challenges in generating adequate returns on shareholder capital. The five-year average return on capital employed is also negative, which underscores a concerning trend of capital inefficiency.<BR><BR>In summary, while the latest profit figures may seem impressive at first glance, they are overshadowed by underlying operational weaknesses and a lack of sustainable growth. Investors should approach Coffee Day's results with caution, as the company continues to face significant challenges in establishing a viable path to profitability.

View full answer

When is the next results date for Coffee Day Enterprises Ltd?

05-Feb-2026

The next results date for Coffee Day Enterprises Ltd is 12 February 2026.

The next results date for Coffee Day Enterprises Ltd is scheduled for 12 February 2026.

View full answer

Is Coffee Day Enter technically bullish or bearish?

03-Dec-2025

As of December 2, 2025, the market trend has shifted to mildly bearish due to bearish signals from the weekly MACD, KST, and Bollinger Bands, despite a strong year-to-date return of 54.95%.

As of 2 December 2025, the technical trend has changed from mildly bullish to mildly bearish. The current technical stance is mildly bearish, driven primarily by the weekly MACD and KST both indicating a bearish outlook, alongside bearish signals from Bollinger Bands and Dow Theory. The daily moving averages remain mildly bullish, but the overall sentiment is tempered by the negative performance in the weekly timeframe. The RSI shows no signals on both weekly and monthly charts, indicating a lack of momentum. Despite a strong year-to-date return of 54.95%, the recent performance relative to the Sensex and the decline from the previous close suggest caution.

View full answer

How has been the historical performance of Coffee Day Enter?

02-Dec-2025

Coffee Day Enter's historical performance shows fluctuating financial metrics, with net sales increasing from 581.58 Cr in Mar'22 to 1,077.86 Cr in Mar'25, but down from a peak of 2,552.44 Cr in Mar'20. Despite improvements in operating profit and cash flow, the company still reported a negative profit after tax of -137.41 Cr in Mar'25.

Answer:<BR>The historical performance of Coffee Day Enter shows a fluctuating trend in key financial metrics over the years.<BR><BR>Breakdown:<BR>Coffee Day Enter's net sales have shown a steady increase from Mar'22 to Mar'25, rising from 581.58 Cr in Mar'22 to 1,077.86 Cr in Mar'25. However, this is a significant decline from the peak of 2,552.44 Cr in Mar'20. The total operating income followed a similar pattern, reaching 1,077.86 Cr in Mar'25, up from 923.85 Cr in Mar'23, but down from 2,552.44 Cr in Mar'20. The total expenditure, excluding depreciation, decreased from 2,930.39 Cr in Mar'20 to 944.51 Cr in Mar'25, indicating improved cost management. Operating profit (PBDIT) turned positive at 181.13 Cr in Mar'25 after a series of negative figures in previous years, while profit before tax improved to -6.18 Cr in Mar'25 from -367.95 Cr in Mar'24. Despite these improvements, the profit after tax remained negative at -137.41 Cr in Mar'25, although it was an improvement from -306.43 Cr in Mar'24. The company's total assets decreased from 9,287.01 Cr in Mar'20 to 4,641.23 Cr in Mar'25, with total liabilities also declining from 6,225.82 Cr in Mar'21 to 4,641.23 Cr in Mar'25. Cash flow from operating activities improved to 195.00 Cr in Mar'25, while net cash inflow was 11.00 Cr, indicating a slight recovery in liquidity. Overall, while Coffee Day Enter has made strides in revenue growth and cost management, it continues to face challenges in achieving profitability.

View full answer

Who are the top shareholders of the Coffee Day Enter?

17-Jul-2025

The top shareholders of Coffee Day Enter include Malavika Hegde with 4.73%, Nls Mauritius LLC with 6.77%, and individual investors holding 68.43%. There are also 18 Foreign Institutional Investors with a combined 0.63%, while no mutual funds currently hold shares.

The top shareholders of Coffee Day Enter include Malavika Hegde, who is the promoter with the highest holding at 4.73%. The highest public shareholder is Nls Mauritius LLC, holding 6.77%. Additionally, individual investors collectively hold a significant 68.43% of the shares. It's also worth noting that there are 18 Foreign Institutional Investors (FIIs) with a combined holding of 0.63%, and there are no mutual funds currently holding shares in the company. The majority of the shareholding is held by non-institutional investors.

View full answer

Is Coffee Day Enter overvalued or undervalued?

09-Jun-2025

As of May 30, 2025, Coffee Day Enter is considered very attractive and undervalued, with a PE ratio of -6.08, a price to book value of 0.23, and a year-to-date return of 45.44%, significantly outperforming its peers and the Sensex.

As of 30 May 2025, the valuation grade for Coffee Day Enter has moved from risky to very attractive. The company is currently considered undervalued, particularly when analyzing its key financial ratios. The PE ratio stands at -6.08, indicating negative earnings, while the price to book value is exceptionally low at 0.23, suggesting that the stock is trading significantly below its book value. Additionally, the EV to EBITDA ratio is 13.40, which is relatively reasonable compared to its peers.<BR><BR>In comparison to its industry peers, Coffee Day Enter's valuation metrics highlight its attractiveness. For instance, Page Industries is categorized as very expensive with a PE ratio of 70.7, and Jubilant Food is also deemed fair with a PE of 203.42. This stark contrast emphasizes Coffee Day Enter's undervaluation. Furthermore, the company's recent stock performance has outpaced the Sensex, with a year-to-date return of 45.44% compared to the Sensex's 5.62%, reinforcing the potential for growth and value realization in the near future.

View full answer

Has Coffee Day Enter declared dividend?

06-Jun-2025

No Dividend History Available

iScoreScore
Click here to find our call on this stock
Strong Sell
Sell
Hold
Buy
Strong Buy

Dashboard

1

Weak Long Term Fundamental Strength with an average Return on Capital Employed (ROCE) of 0.25%

  • Poor long term growth as Net Sales has grown by an annual rate of 9.47% and Operating profit at 15.01% over the last 5 years
  • Company's ability to service its debt is weak with a poor EBIT to Interest (avg) ratio of -1.22
2

Despite the size of the company, domestic mutual funds hold only 0% of the company

stock-summaryMojo Parameters

Mojo Parameters

Loading Valuation Snapshot...

Stock DNA

stock-summary
Industry

Leisure Services

stock-summary
Market cap

INR 718 Cr (Micro Cap)

stock-summary
P/E

NA (Loss Making)

stock-summary
Industry P/E

41

stock-summary
Dividend Yield

0.00%

stock-summary
Debt Equity

0.29

stock-summary
Return on Equity

-0.97%

stock-summary
Price to Book

0.26

Revenue and Profits:
Net Sales:
281 Cr
(Quarterly Results - Mar 2026)
Net Profit:
132 Cr
stock-summaryTotal Returns
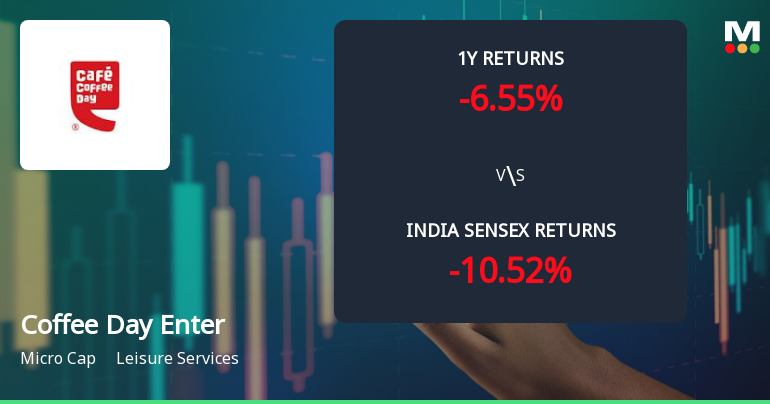
Total Returns (Price + Dividend) stock-summary
Dividend Yield (0%)
TimePeriod
Price Return
Dividend Return
Total Return
3 Months
33.27%
0%
33.27%
6 Months
4.07%
0%
4.07%
1 Year
-4.84%
0%
-4.84%
2 Years
-40.84%
0%
-40.84%
3 Years
-6.15%
0%
-6.15%
4 Years
-31.78%
0%
-31.78%
5 Years
-15.29%
0%
-15.29%

Coffee Day Enter for the last several years.

Risk Adjusted Returns v/s stock-summary
Returns Beta
Icon
Beta has not been calculated since enough price history is not available
stock-summaryNews & Corporate Actions

Announcements stock-summary

Regulation 47

29-May-2026 | Source : BSE

Regulation 47 - News Paper Publication

Announcement under Regulation 30 (LODR)-Newspaper Publication

29-May-2026 | Source : BSE

Due to an inadvertent error in the news paper publication date resubmitting.

Disclosures under Reg. 31(1) and 31(2) of SEBI (SAST) Regulations 2011.

27-Apr-2026 | Source : BSE

The Exchange has received Disclosure under Regulation 31(1) and 31(2) of SEBI (Substantial Acquisition of Shares & Takeovers) Regulations 2011 on April 27 2026 for Coffee Day Consolidations Pvt Ltd

Corporate Actions stock-summary

stock-summary
BOARD MEETING

No Upcoming Board Meetings

stock-summary
DIVIDEND

No Dividend history available

stock-summary
SPLITS

No Splits history available

stock-summary
BONUS

No Bonus history available

stock-summary
RIGHTS

No Rights history available

stock-summaryKey Factors

Quality key factors stock-summary

Factor
Value
Sales Growth (5y)
9.47%
EBIT Growth (5y)
15.01%
EBIT to Interest (avg)
-1.22
Debt to EBITDA (avg)
Negative Net Debt
Net Debt to Equity (avg)
0.29
Sales to Capital Employed (avg)
0.21
Tax Ratio
Tax Ratio is Negative%
Dividend Payout Ratio
0
Pledged Shares
2.11%
Institutional Holding
3.23%
ROCE (avg)
-2.45%
ROE (avg)
1.09%

Valuation key factors

Factor
Value
P/E Ratio
NA (Loss Making)
Industry P/E
41
Price to Book Value
0.26
EV to EBIT
249.80
EV to EBITDA
10.15
EV to Capital Employed
0.42
EV to Sales
1.36
PEG Ratio
NA
Dividend Yield
NA
ROCE (Latest)
0.17%
ROE (Latest)
-0.97%

Technicals key factors

Indicator
Weekly
Monthly
MACD
Mildly Bullish
Bearish
RSI
No Signal
No Signal
Bollinger Bands
Mildly Bullish
Mildly Bullish
Moving Averages
Mildly Bearish (Daily)
KST
Mildly Bullish
Mildly Bullish
Dow Theory
Mildly Bullish
Mildly Bullish
OBV
No Trend
Bullish
stock-summary Technical Indicator Scale: Bearish, Mildly Bearish, Sideways, Mildly Bullish, Bullish  Turned 
stock-summaryShareholding
Shareholding Snapshot : Mar 2026stock-summary
Shareholding Compare (%holding) stock-summary
Majority shareholders

Non Institution

Pledged Promoter Holdings

2.1147

Mutual Funds

Held by 0 Schemes

FIIs

Held by 12 FIIs (0.85%)

Promoter with highest holding

Ahih Resorts And Retreat Private Limited (4.28%)

Highest Public shareholder

Nls Mauritius Llc (4.76%)

Individual Investors Holdings

69.07%

stock-summaryFinancial
[
  {
    "link": "quarterly",
    "btn_text": "All Quarterly Results",
    "header": "Quarterly Results Snapshot (Consolidated) - Mar'26 - YoY",
    "rhs": [
      {
        "prefix": "Net Sales ",
        "suffix": "YoY Growth in quarter ended Mar 2026 is 4.66% vs 6.93% in Mar 2025",
        "dir": -1
      },
      {
        "prefix": "Consolidated Net Profit ",
        "suffix": "YoY Growth in quarter ended Mar 2026 is 499.94% vs 89.09% in Mar 2025",
        "dir": 1
      }
    ],
    "table": {
      "header": [
        "Mar'26",
        "Mar'25",
        "Change(%)"
      ],
      "body": [
        {
          "field": "Net Sales",
          "val1": "280.51",
          "val2": "268.03",
          "chgp": "4.66%",
          "chgp_class": "positive"
        },
        {
          "field": "Operating Profit (PBDIT) excl Other Income",
          "val1": "50.74",
          "val2": "28.08",
          "chgp": "80.70%",
          "chgp_class": "positive"
        },
        {
          "field": "Interest",
          "val1": "25.74",
          "val2": "45.51",
          "chgp": "-43.44%",
          "chgp_class": "positive"
        },
        {
          "field": "Exceptional Items",
          "val1": "140.89",
          "val2": "47.89",
          "chgp": "194.20%",
          "chgp_class": "positive"
        },
        {
          "field": "Consolidate Net Profit",
          "val1": "132.06",
          "val2": "-33.02",
          "chgp": "499.94%",
          "chgp_class": "positive"
        },
        {
          "field": "Operating Profit Margin (Excl OI)",
          "val1": "18.09%",
          "val2": "10.48%",
          "chgp": "7.61%",
          "chgp_class": "positive"
        }
      ]
    }
  },
  {
    "link": "half-yearly",
    "btn_text": "All Half Yearly Results",
    "header": "Half Yearly Results Snapshot (Consolidated) - Sep'25",
    "rhs": [
      {
        "prefix": "Net Sales ",
        "suffix": " Growth in half year ended Sep 2025 is 3.67% vs 4.69% in Sep 2024",
        "dir": -1
      },
      {
        "prefix": "Consolidated Net Profit ",
        "suffix": " Growth in half year ended Sep 2025 is 206.65% vs 83.44% in Sep 2024",
        "dir": 1
      }
    ],
    "table": {
      "header": [
        "Sep'25",
        "Sep'24",
        "Change(%)"
      ],
      "body": [
        {
          "field": "Net Sales",
          "val1": "548.85",
          "val2": "529.41",
          "chgp": "3.67%",
          "chgp_class": "positive"
        },
        {
          "field": "Operating Profit (PBDIT) excl Other Income",
          "val1": "63.92",
          "val2": "64.38",
          "chgp": "-0.71%",
          "chgp_class": "negative"
        },
        {
          "field": "Interest",
          "val1": "46.33",
          "val2": "43.21",
          "chgp": "7.22%",
          "chgp_class": "negative"
        },
        {
          "field": "Exceptional Items",
          "val1": "34.98",
          "val2": "0.00",
          "chgp": "",
          "chgp_class": "neutral"
        },
        {
          "field": "Consolidate Net Profit",
          "val1": "15.72",
          "val2": "-14.74",
          "chgp": "206.65%",
          "chgp_class": "positive"
        },
        {
          "field": "Operating Profit Margin (Excl OI)",
          "val1": "11.65%",
          "val2": "12.16%",
          "chgp": "-0.51%",
          "chgp_class": "negative"
        }
      ]
    }
  },
  {
    "link": "nine-monthly",
    "btn_text": "All Nine Monthly Results",
    "header": "Nine Monthly Results Snapshot (Consolidated) - Dec'25",
    "rhs": [
      {
        "prefix": "Net Sales ",
        "suffix": "YoY Growth in nine months ended Dec 2025 is 3.14% vs 6.19% in Dec 2024",
        "dir": -1
      },
      {
        "prefix": "Consolidated Net Profit ",
        "suffix": "YoY Growth in nine months ended Dec 2025 is 383.85% vs -26.24% in Dec 2024",
        "dir": 1
      }
    ],
    "table": {
      "header": [
        "Dec'25",
        "Dec'24",
        "Change(%)"
      ],
      "body": [
        {
          "field": "Net Sales",
          "val1": "835.24",
          "val2": "809.82",
          "chgp": "3.14%",
          "chgp_class": "positive"
        },
        {
          "field": "Operating Profit (PBDIT) excl Other Income",
          "val1": "98.88",
          "val2": "105.26",
          "chgp": "-6.06%",
          "chgp_class": "negative"
        },
        {
          "field": "Interest",
          "val1": "66.57",
          "val2": "64.27",
          "chgp": "3.58%",
          "chgp_class": "negative"
        },
        {
          "field": "Exceptional Items",
          "val1": "97.46",
          "val2": "0.00",
          "chgp": "",
          "chgp_class": "neutral"
        },
        {
          "field": "Consolidate Net Profit",
          "val1": "71.02",
          "val2": "-25.02",
          "chgp": "383.85%",
          "chgp_class": "positive"
        },
        {
          "field": "Operating Profit Margin (Excl OI)",
          "val1": "11.84%",
          "val2": "13.00%",
          "chgp": "-1.16%",
          "chgp_class": "negative"
        }
      ]
    }
  },
  {
    "link": "annual",
    "btn_text": "All Annual Results",
    "header": "Annual Results Snapshot (Consolidated) - Mar'26",
    "rhs": [
      {
        "prefix": "Net Sales ",
        "suffix": "YoY Growth in year ended Mar 2026 is 3.52% vs 6.38% in Mar 2025",
        "dir": -1
      },
      {
        "prefix": "Consolidated Net Profit ",
        "suffix": "YoY Growth in year ended Mar 2026 is 449.84% vs 82.00% in Mar 2025",
        "dir": 1
      }
    ],
    "table": {
      "header": [
        "Mar'26",
        "Mar'25",
        "Change(%)"
      ],
      "body": [
        {
          "field": "Net Sales",
          "val1": "1,115.75",
          "val2": "1,077.86",
          "chgp": "3.52%",
          "chgp_class": "positive"
        },
        {
          "field": "Operating Profit (PBDIT) excl Other Income",
          "val1": "135.55",
          "val2": "133.35",
          "chgp": "1.65%",
          "chgp_class": "positive"
        },
        {
          "field": "Interest",
          "val1": "92.31",
          "val2": "109.78",
          "chgp": "-15.91%",
          "chgp_class": "positive"
        },
        {
          "field": "Exceptional Items",
          "val1": "238.34",
          "val2": "47.89",
          "chgp": "397.68%",
          "chgp_class": "positive"
        },
        {
          "field": "Consolidate Net Profit",
          "val1": "203.08",
          "val2": "-58.05",
          "chgp": "449.84%",
          "chgp_class": "positive"
        },
        {
          "field": "Operating Profit Margin (Excl OI)",
          "val1": "12.15%",
          "val2": "12.37%",
          "chgp": "-0.22%",
          "chgp_class": "negative"
        }
      ]
    }
  }
]

Quarterly Results Snapshot (Consolidated) - Mar'26 - YoYstock-summary

Mar'26
Mar'25
Change(%)
Net Sales
280.51
268.03
4.66%
Operating Profit (PBDIT) excl Other Income
50.74
28.08
80.70%
Interest
25.74
45.51
-43.44%
Exceptional Items
140.89
47.89
194.20%
Consolidate Net Profit
132.06
-33.02
499.94%
Operating Profit Margin (Excl OI)
18.09%
10.48%
7.61%
Values in Rs Cr.
Direction Arrows
Net Sales

YoY Growth in quarter ended Mar 2026 is 4.66% vs 6.93% in Mar 2025

Direction Arrows
Consolidated Net Profit

YoY Growth in quarter ended Mar 2026 is 499.94% vs 89.09% in Mar 2025

Half Yearly Results Snapshot (Consolidated) - Sep'25stock-summary

Sep'25
Sep'24
Change(%)
Net Sales
548.85
529.41
3.67%
Operating Profit (PBDIT) excl Other Income
63.92
64.38
-0.71%
Interest
46.33
43.21
7.22%
Exceptional Items
34.98
0.00
Consolidate Net Profit
15.72
-14.74
206.65%
Operating Profit Margin (Excl OI)
11.65%
12.16%
-0.51%
Values in Rs Cr.
Direction Arrows
Net Sales

Growth in half year ended Sep 2025 is 3.67% vs 4.69% in Sep 2024

Direction Arrows
Consolidated Net Profit

Growth in half year ended Sep 2025 is 206.65% vs 83.44% in Sep 2024

Nine Monthly Results Snapshot (Consolidated) - Dec'25stock-summary

Dec'25
Dec'24
Change(%)
Net Sales
835.24
809.82
3.14%
Operating Profit (PBDIT) excl Other Income
98.88
105.26
-6.06%
Interest
66.57
64.27
3.58%
Exceptional Items
97.46
0.00
Consolidate Net Profit
71.02
-25.02
383.85%
Operating Profit Margin (Excl OI)
11.84%
13.00%
-1.16%
Values in Rs Cr.
Direction Arrows
Net Sales

YoY Growth in nine months ended Dec 2025 is 3.14% vs 6.19% in Dec 2024

Direction Arrows
Consolidated Net Profit

YoY Growth in nine months ended Dec 2025 is 383.85% vs -26.24% in Dec 2024

Annual Results Snapshot (Consolidated) - Mar'26stock-summary

Mar'26
Mar'25
Change(%)
Net Sales
1,115.75
1,077.86
3.52%
Operating Profit (PBDIT) excl Other Income
135.55
133.35
1.65%
Interest
92.31
109.78
-15.91%
Exceptional Items
238.34
47.89
397.68%
Consolidate Net Profit
203.08
-58.05
449.84%
Operating Profit Margin (Excl OI)
12.15%
12.37%
-0.22%
Values in Rs Cr.
Direction Arrows
Net Sales

YoY Growth in year ended Mar 2026 is 3.52% vs 6.38% in Mar 2025

Direction Arrows
Consolidated Net Profit

YoY Growth in year ended Mar 2026 is 449.84% vs 82.00% in Mar 2025

stock-summaryCompany CV
About Coffee Day Enterprises Ltd stock-summary
stock-summary
Coffee Day Enterprises Ltd
Micro Cap
Leisure Services
Coffee Day Enterprises Limited was originally formed as a Partnership Firm constituted under the Indian Partnership Act, 1932 on February 1, 2008 under the name Coffeeday Holding Co. pursuant to a Deed of Partnership. Coffeeday Holding Co. was thereafter converted from a Partnership Firm to a Private Limited Company as Coffee Day Holdings Company Private Limited and a fresh Certificate of Incorporation was issued by the RoC on June 20, 2008.
Company Coordinates stock-summary
Company Details
23/2 Coffee Day Square, Vittal Mallya Road Bangaluru Karnataka : 560001
stock-summary
Tel: 91-80-40012345
stock-summary
investor@coffeeday.com
Registrar Details
Link Intime India Pvt Ltd, C-13 Pannalal Silk Compound, L B S Marg, Bhandup , Mumbai