
Compare Colinz Labs with Similar Stocks
Dashboard
Weak Long Term Fundamental Strength with a -0.10% CAGR growth in Net Sales over the last 5 years
- Company's ability to service its debt is weak with a poor EBIT to Interest (avg) ratio of 0.38
- The company has been able to generate a Return on Equity (avg) of 4.90% signifying low profitability per unit of shareholders funds
Flat results in Mar 26
With ROE of 5.2, it has a Attractive valuation with a 1.5 Price to Book Value
Majority shareholders : Promoters
Stock DNA
Pharmaceuticals & Biotechnology
INR 15 Cr (Micro Cap)
29.00
34
0.00%
-0.68
5.16%
1.50
Total Returns (Price + Dividend) 
Colinz Labs for the last several years.
Risk Adjusted Returns v/s
Returns Beta

News
Colinz Laboratories Ltd Upgraded to Hold on Attractive Valuation and Stable Fundamentals
Colinz Laboratories Ltd has seen its investment rating upgraded from Sell to Hold, driven primarily by an improved valuation profile and steady financial trends despite flat quarterly results. The micro-cap pharmaceutical company’s recent performance and comparative metrics have prompted a reassessment of its quality, valuation, financial trend, and technical outlook, culminating in a more favourable stance by analysts.
Read full news article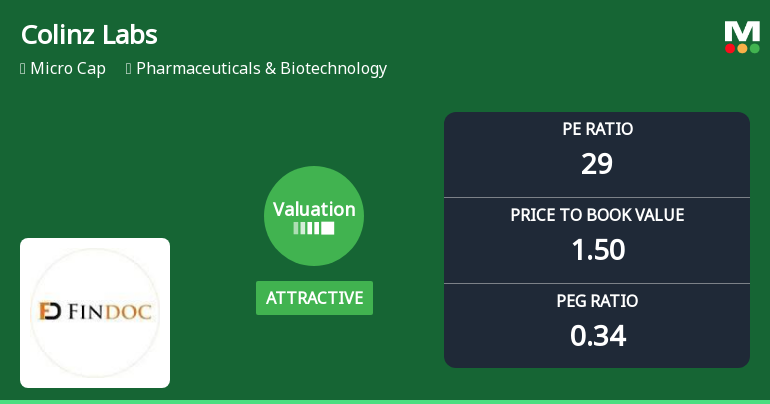
Colinz Laboratories Ltd Valuation Shifts Signal Renewed Price Attractiveness
Colinz Laboratories Ltd, a micro-cap player in the Pharmaceuticals & Biotechnology sector, has seen its valuation parameters shift favourably, prompting an upgrade in its Mojo Grade from Sell to Hold. Despite a recent 4.98% dip in share price, the stock’s price-to-earnings (P/E) and price-to-book value (P/BV) ratios now present a more attractive entry point relative to its historical and peer averages, signalling potential value for discerning investors.
Read full news article
Colinz Laboratories Ltd Downgraded to Sell Amid Mixed Technicals and Fair Valuation
Colinz Laboratories Ltd, a micro-cap player in the Pharmaceuticals & Biotechnology sector, has seen its investment rating downgraded from Hold to Sell as of 3 June 2026. This shift reflects a complex interplay of technical improvements, valuation adjustments, and subdued financial trends, prompting a reassessment of the stock’s attractiveness despite recent price gains.
Read full news article Announcements
Clarification sought from Colinz Laboratories Ltd
01-Jun-2026 | Source : BSEThe Exchange has sought clarification from Colinz Laboratories Ltd on June 1 2026 with reference to significant movement in price in order to ensure that investors have latest relevant information about the company and to inform the market so that the interest of the investors is safeguarded.
The reply is awaited.
Submission Of Disclosure Under Regulation 29(2) Of SEBI (Substantial Acquisition Of Shares And Takeovers) Regulations 2011
26-May-2026 | Source : BSEDear Sir Submitting the Dislosure under Regulatiom 29(2) under SEBI (SAST) Regulation 2011. Sumitted by Vijaya Mani the Promoter and Director of the Company anaingt sell of her Equity Shares. Kindly take the note of the same. For COlinz Labs Ltd Ganesh Chitte CFO
Submission Of Disclosure Under Regulation 29(2) Of SEBI (Substantial Acquisition Of Shares And Takeovers) Regulations 2011
26-May-2026 | Source : BSEDear Sir Submitting herewith the Disclosure 29(1) as required under SEBI (SAST) Regulations 2011 submitted by Mr Padam Dugar the acquirer . Kindly take the same on records. For Colinz Labs Ltd Ganesh Chitte CFO
Corporate Actions

No Upcoming Board Meetings

No Dividend history available

No Splits history available

No Bonus history available

No Rights history available
Quality key factors
Valuation key factors
Technicals key factors
 Technical Indicator Scale: Bearish, Mildly Bearish, Sideways, Mildly Bullish, Bullish Turned
 Shareholding Snapshot : Mar 2026
Shareholding Compare (%holding)
Promoters
None
Held by 0 Schemes
Held by 0 FIIs
Vijaya Mani (49.56%)
Dipakbhai Haribhai Gaudani (1.31%)
31.22%
Quarterly Results Snapshot (Standalone) - Mar'26 - QoQ

QoQ Growth in quarter ended Mar 2026 is 22.38% vs 2.88% in Dec 2025
QoQ Growth in quarter ended Mar 2026 is 112.50% vs -42.86% in Dec 2025
Half Yearly Results Snapshot (Standalone) - Sep'25

Growth in half year ended Sep 2025 is -18.28% vs -2.17% in Sep 2024
Growth in half year ended Sep 2025 is -10.34% vs 20.83% in Sep 2024
Nine Monthly Results Snapshot (Standalone) - Dec'25
YoY Growth in nine months ended Dec 2025 is -13.78% vs -5.93% in Dec 2024
YoY Growth in nine months ended Dec 2025 is 0.00% vs -2.86% in Dec 2024
Annual Results Snapshot (Standalone) - Mar'26
YoY Growth in year ended Mar 2026 is -5.97% vs -7.11% in Mar 2025
YoY Growth in year ended Mar 2026 is 2.00% vs 2.04% in Mar 2025
About Colinz Laboratories Ltd

Company Coordinates


