
Compare Colinz Labs with Similar Stocks
Dashboard
Weak Long Term Fundamental Strength with a -0.10% CAGR growth in Net Sales over the last 5 years
- Company's ability to service its debt is weak with a poor EBIT to Interest (avg) ratio of 0.38
- The company has been able to generate a Return on Equity (avg) of 4.90% signifying low profitability per unit of shareholders funds
Flat results in Mar 26
With ROE of 5.2, it has a Expensive valuation with a 2.1 Price to Book Value
Reducing Promoter Confidence
Stock DNA
Pharmaceuticals & Biotechnology
INR 21 Cr (Micro Cap)
40.00
36
0.00%
-0.68
5.16%
2.04
Total Returns (Price + Dividend) 
Colinz Labs for the last several years.
Risk Adjusted Returns v/s
Returns Beta

News
Colinz Laboratories Ltd Valuation Shifts Signal Caution Amid Strong Returns
Colinz Laboratories Ltd, a micro-cap player in the Pharmaceuticals & Biotechnology sector, has seen its valuation parameters shift notably, moving from fair to expensive territory. This change, coupled with a recent downgrade in its Mojo Grade from Hold to Sell, raises important questions about the stock’s price attractiveness amid a backdrop of strong returns relative to the Sensex.
Read full news article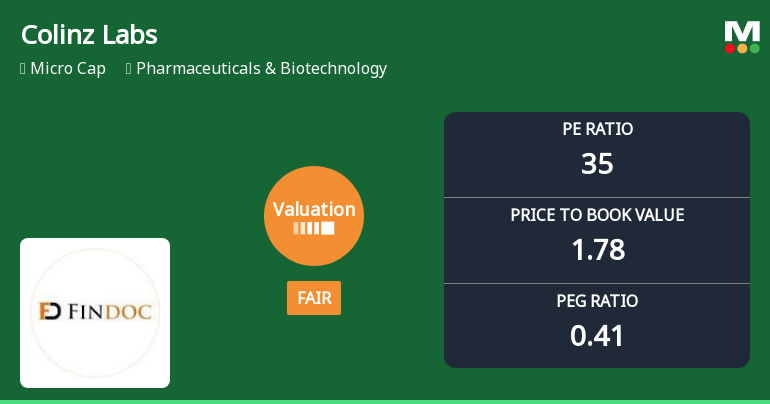
Colinz Laboratories Ltd Valuation Shifts Signal Renewed Price Attractiveness
Colinz Laboratories Ltd, a micro-cap player in the Pharmaceuticals & Biotechnology sector, has recently undergone a notable shift in its valuation parameters, moving from an expensive to a fair valuation grade. This change, coupled with its robust multi-year returns outperforming the Sensex, invites a closer examination of its price attractiveness relative to historical levels and peer benchmarks.
Read full news article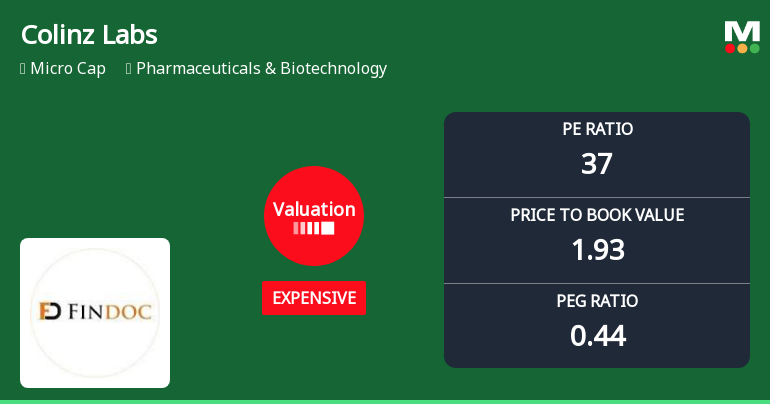
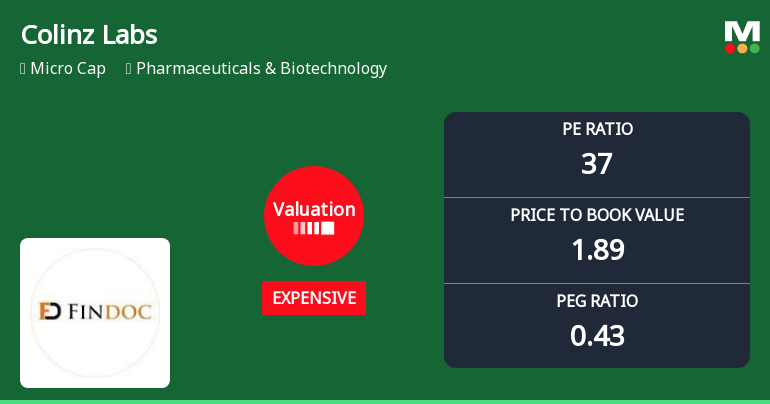
Colinz Laboratories Ltd Valuation Shifts Signal Price Attractiveness Challenges
Colinz Laboratories Ltd, a micro-cap player in the Pharmaceuticals & Biotechnology sector, has seen a notable shift in its valuation parameters, prompting a downgrade in its investment grade from Hold to Sell. With its price-to-earnings (P/E) ratio rising to 37.32 and price-to-book value (P/BV) at 1.93, the stock now trades in the 'expensive' category, raising questions about its price attractiveness relative to historical and peer benchmarks.
Read full news article Announcements
Board Meeting Intimation for Notice Of Date Of Board Meeting Pursuant To Regulation 29(2) Of SEBI (LODR) Regulations 2015.
18-Jul-2026 | Source : BSEColinz Laboratories Ltdhas informed BSE that the meeting of the Board of Directors of the Company is scheduled on 30/07/2026 inter alia to consider and approve This is to inform the exchange that the meeting of the Board of Directors of the Company pursuant to Regulation 29(2) & 33 of SEBI (LODR) Regulations 2015 is scheduled to be held on Thursday 30th July 2026 at the registered office of the Company at A-101 Pratik Industrial Estate Mulund Link Road Mumbai Maharashtra 400078 at 3.30 p.m. inter-alia The detailed ponits aare attached to this letter kindly take the same on records. For Colinz Labs Ltd Director
Closure of Trading Window
14-Jul-2026 | Source : BSEDear Sir As required under under SEBI Regulation 2015 Please find the attached intimation towards closure of Trading form 1-7-2026 till the 48 hours of the Issue of Quarterly results as on 30-6-2026. Kindly take the same on records. For Colinz Labs Ltd Director
Compliances-Certificate under Reg. 74 (5) of SEBI (DP) Regulations 2018
07-Jul-2026 | Source : BSEDear Sir Please find the attached Certificate issued by our RTA Bigshare Services Pvt Ltd. for the Quarter ended on 30-6-2026 as required under regulation 74(5). Kindly tahe the same o records. for Colinz Labs Ltd Director
Corporate Actions

30 Jul 2026

No Dividend history available

No Splits history available

No Bonus history available

No Rights history available
Quality key factors
Valuation key factors
Technicals key factors
 Technical Indicator Scale: Bearish, Mildly Bearish, Sideways, Mildly Bullish, Bullish Turned
 Shareholding Snapshot : Jun 2026
Shareholding Compare (%holding)
Promoters
None
Held by 0 Schemes
Held by 0 FIIs
Vijaya Mani (34.56%)
Padam Dugar (12.54%)
46.19%
Quarterly Results Snapshot (Standalone) - Mar'26 - QoQ

QoQ Growth in quarter ended Mar 2026 is 22.38% vs 2.88% in Dec 2025
QoQ Growth in quarter ended Mar 2026 is 112.50% vs -42.86% in Dec 2025
Half Yearly Results Snapshot (Standalone) - Sep'25

Growth in half year ended Sep 2025 is -18.28% vs -2.17% in Sep 2024
Growth in half year ended Sep 2025 is -10.34% vs 20.83% in Sep 2024
Nine Monthly Results Snapshot (Standalone) - Dec'25
YoY Growth in nine months ended Dec 2025 is -13.78% vs -5.93% in Dec 2024
YoY Growth in nine months ended Dec 2025 is 0.00% vs -2.86% in Dec 2024
Annual Results Snapshot (Standalone) - Mar'26
YoY Growth in year ended Mar 2026 is -5.97% vs -7.11% in Mar 2025
YoY Growth in year ended Mar 2026 is 2.00% vs 2.04% in Mar 2025
About Colinz Laboratories Ltd

Company Coordinates


