
Compare Comfort Fincap with Similar Stocks
Stock DNA
Non Banking Financial Company (NBFC)
INR 71 Cr (Micro Cap)
10.00
20
1.26%
0.04
7.49%
0.70
Total Returns (Price + Dividend) 
Latest dividend: 0.1 per share ex-dividend date: Sep-04-2025
Risk Adjusted Returns v/s
Returns Beta

News
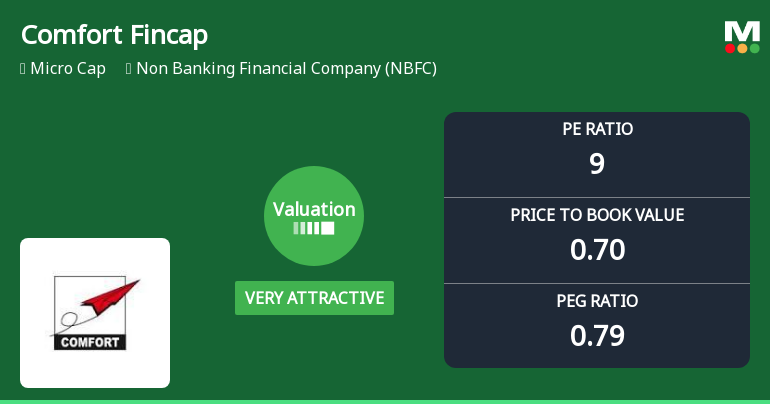
Comfort Fincap Ltd Valuation Shifts Signal Renewed Price Attractiveness
Comfort Fincap Ltd, a micro-cap player in the Non Banking Financial Company (NBFC) sector, has seen a significant shift in its valuation parameters, moving from an attractive to a very attractive rating. Despite a recent decline in share price, the company’s price-to-earnings (P/E) and price-to-book value (P/BV) ratios now present a compelling case for value investors, especially when compared to its peers and historical benchmarks.
Read full news article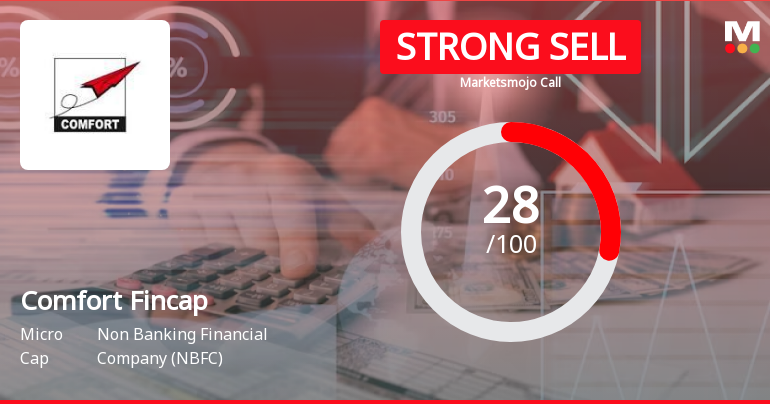
Comfort Fincap Ltd is Rated Strong Sell
Comfort Fincap Ltd is rated Strong Sell by MarketsMOJO, with this rating last updated on 14 May 2026. However, the analysis and financial metrics discussed here reflect the stock’s current position as of 08 June 2026, providing investors with the latest insights into the company’s performance and outlook.
Read full news article
Comfort Fincap Ltd is Rated Strong Sell
Comfort Fincap Ltd is rated Strong Sell by MarketsMOJO, with this rating last updated on 14 May 2026. However, the analysis and financial metrics discussed here reflect the stock’s current position as of 25 May 2026, providing investors with the latest insights into the company’s performance and outlook.
Read full news article Announcements
Intimation For Receipt Of Trading Approval For 2500000 Equity Shares Issued On Preferential Basis.
08-Jun-2026 | Source : BSEReceipt of Trading Approval for 2500000 equity shares issued on Preferential Basis.
Compliances-Reg.24(A)-Annual Secretarial Compliance
19-May-2026 | Source : BSEPursuant to Regulation 24(A) of the SEBI Listing Regulations we enclose herewith Annual Secretarial Compliance Report for the financial year ended March 31 2026.
Announcement under Regulation 30 (LODR)-Newspaper Publication
15-May-2026 | Source : BSENewspaper Publication for the Financial Result for the quater and financial year ended March 31 2026.
Corporate Actions

No Upcoming Board Meetings

Comfort Fincap Ltd has declared 5% dividend, ex-date: 04 Sep 25

Comfort Fincap Ltd has announced 2:10 stock split, ex-date: 04 May 23

No Bonus history available

No Rights history available
Quality key factors
Valuation key factors
Technicals key factors
 Technical Indicator Scale: Bearish, Mildly Bearish, Sideways, Mildly Bullish, Bullish Turned
 Shareholding Snapshot : Apr 2026
Shareholding Compare (%holding)
Promoters
None
Held by 0 Schemes
Held by 0 FIIs
Luharuka Investment & Consultants Pvt Ltd (24.37%)
Ashish Bansal (4.08%)
37.63%
Quarterly Results Snapshot (Consolidated) - Mar'26 - YoY

YoY Growth in quarter ended Mar 2026 is 3.36% vs 9.32% in Mar 2025

YoY Growth in quarter ended Mar 2026 is 38.96% vs 4.05% in Mar 2025
Half Yearly Results Snapshot (Consolidated) - Sep'25
Growth in half year ended Sep 2025 is 25.70% vs -16.13% in Sep 2024
Growth in half year ended Sep 2025 is 39.06% vs -5.71% in Sep 2024
Nine Monthly Results Snapshot (Consolidated) - Dec'25
YoY Growth in nine months ended Dec 2025 is 28.04% vs -8.78% in Dec 2024
YoY Growth in nine months ended Dec 2025 is 48.27% vs -2.48% in Dec 2024
Annual Results Snapshot (Consolidated) - Mar'26
YoY Growth in year ended Mar 2026 is 21.04% vs 13.47% in Mar 2025
YoY Growth in year ended Mar 2026 is 46.86% vs -0.97% in Mar 2025
About Comfort Fincap Ltd

Company Coordinates


