
Compare Comfort Intech with Similar Stocks
Dashboard
Weak Long Term Fundamental Strength with an average Return on Equity (ROE) of 5.87%
- Poor long term growth as Operating profit has grown by an annual rate of -2.64%
Flat results in Mar 26
With ROE of -1.8, it has a Very Expensive valuation with a 1.1 Price to Book Value
26.48% of Promoter Shares are Pledged
Below par performance in long term as well as near term
Stock DNA
Beverages
INR 193 Cr (Micro Cap)
NA (Loss Making)
20
1.17%
0.11
-1.84%
1.11
Total Returns (Price + Dividend) 
Latest dividend: 0.07 per share ex-dividend date: Sep-18-2025
Risk Adjusted Returns v/s
Returns Beta

News
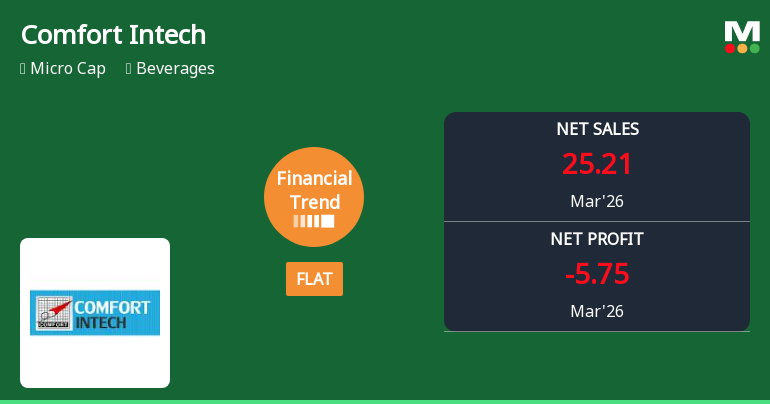
Comfort Intech Ltd Reports Sharp Quarterly Decline Amid Negative Financial Trend
Comfort Intech Ltd, a micro-cap player in the beverages sector, has reported a significant deterioration in its recent quarterly financial performance, marking a shift from a previously flat trend to a distinctly negative trajectory. Despite a strong six-month sales growth, the company’s latest quarter reveals troubling declines in revenue and profitability, raising concerns among investors and analysts alike.
Read full news article
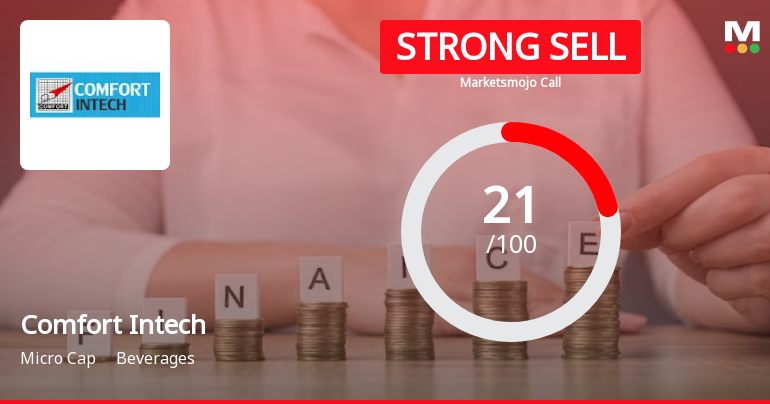
Comfort Intech Ltd is Rated Strong Sell
Comfort Intech Ltd is rated Strong Sell by MarketsMOJO. This rating was last updated on 20 Jan 2025. However, the analysis and financial metrics presented here reflect the stock’s current position as of 29 May 2026, providing investors with an up-to-date view of the company’s fundamentals, valuation, financial trend, and technical outlook.
Read full news article Announcements
Compliances-Reg.24(A)-Annual Secretarial Compliance
19-May-2026 | Source : BSEPursuant to Regulation 24(A) of the SEBI Listing Regulations we enclose herewith Annual Secretarial Compliance Report for the financial year ended March 31 2026.
Announcement under Regulation 30 (LODR)-Newspaper Publication
15-May-2026 | Source : BSENewspaper Publication for the Financial Result for the quater and financial year ended March 31 2026.
Announcement under Regulation 30 (LODR)-Investor Presentation
15-May-2026 | Source : BSEInvestor Presentation for Quarter IV and FY 25-26 Business Operations of the Company.
Corporate Actions

No Upcoming Board Meetings

Comfort Intech Ltd has declared 7% dividend, ex-date: 18 Sep 25

Comfort Intech Ltd has announced 1:10 stock split, ex-date: 13 Apr 23

No Bonus history available

Comfort Intech Ltd has announced 1:1 rights issue, ex-date: 02 Jun 10
Quality key factors
Valuation key factors
Technicals key factors
 Technical Indicator Scale: Bearish, Mildly Bearish, Sideways, Mildly Bullish, Bullish Turned
 Shareholding Snapshot : Mar 2026
Shareholding Compare (%holding)
Promoters
26.4751
Held by 0 Schemes
Held by 0 FIIs
Luharuka Exports Pvt Ltd (26.44%)
None
38.83%
Quarterly Results Snapshot (Consolidated) - Mar'26 - QoQ

QoQ Growth in quarter ended Mar 2026 is -58.92% vs 60.78% in Dec 2025
QoQ Growth in quarter ended Mar 2026 is -1,302.44% vs 80.66% in Dec 2025
Half Yearly Results Snapshot (Consolidated) - Sep'25
Growth in half year ended Sep 2025 is -29.54% vs 66.19% in Sep 2024
Growth in half year ended Sep 2025 is -77.00% vs 73.80% in Sep 2024
Nine Monthly Results Snapshot (Consolidated) - Dec'25
YoY Growth in nine months ended Dec 2025 is -7.20% vs 34.63% in Dec 2024
YoY Growth in nine months ended Dec 2025 is -84.99% vs 20.89% in Dec 2024
Annual Results Snapshot (Consolidated) - Mar'26
YoY Growth in year ended Mar 2026 is -5.71% vs -0.76% in Mar 2025
YoY Growth in year ended Mar 2026 is -128.00% vs -34.38% in Mar 2025
About Comfort Intech Ltd

Company Coordinates


