
Compare Competent Auto with Similar Stocks
Dashboard
Weak Long Term Fundamental Strength with an average Return on Capital Employed (ROCE) of 7.29%
- Poor long term growth as Net Sales has grown by an annual rate of 13.18% and Operating profit at 12.32% over the last 5 years
- Low ability to service debt as the company has a high Debt to EBITDA ratio of 4.52 times
Underperformed the market in the last 1 year
Total Returns (Price + Dividend) 
Latest dividend: 1 per share ex-dividend date: Sep-19-2025
Risk Adjusted Returns v/s
Returns Beta

News

Competent Automobiles Company Ltd is Rated Sell
Competent Automobiles Company Ltd is rated 'Sell' by MarketsMOJO. This rating was last updated on 04 May 2026, reflecting a reassessment of the stock’s outlook. However, all fundamentals, returns, and financial metrics discussed here are current as of 11 June 2026, providing investors with the latest view on the company’s position in the market.
Read full news articleAre Competent Automobiles Company Ltd latest results good or bad?
Competent Automobiles Company Ltd's latest financial results for Q4 FY26 present a mixed narrative. The company reported a net profit of ₹8.65 crores, reflecting a year-on-year growth of 16.89% compared to the previous year. Revenue for the quarter reached ₹619.95 crores, marking a significant increase of 20.09% from ₹516.22 crores in Q4 FY25. However, these results come amidst a challenging demand environment, with a notable sequential decline in revenue of 25.66% from the preceding quarter's ₹833.99 crores. The operating profit margin for Q4 FY26 was recorded at 4.65%, slightly lower than the 4.69% from the same quarter last year, yet it shows improvement from the 3.32% margin reported in Q3 FY26. This indicates the company's ability to maintain profitability despite facing volume challenges. Additionally, the reduction in interest costs to ₹6.97 crores from ₹8.94 crores in the previous quarter contribut...
Read full news article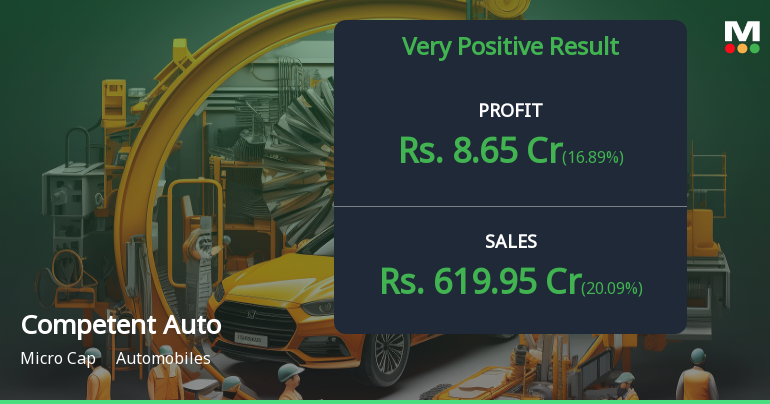
Competent Automobiles Q4 FY26: Margin Expansion Drives 16.89% Profit Growth Despite Muted Volumes
Competent Automobiles Company Ltd., the Delhi-based authorised dealer for Maruti Suzuki vehicles, reported a net profit of ₹8.65 crores for Q4 FY26, marking a 16.89% year-on-year growth from ₹7.40 crores in Q4 FY25. The micro-cap automobile dealer, with a market capitalisation of ₹223.00 crores, demonstrated resilience through margin expansion even as quarterly revenues declined 25.66% sequentially to ₹619.95 crores. The stock currently trades at ₹368.80, down 17.01% from its 52-week high of ₹444.40, reflecting investor concerns about the company's modest profitability metrics and high leverage position.
Read full news article Announcements
Announcement under Regulation 30 (LODR)-Newspaper Publication
01-Jun-2026 | Source : BSENewspaper Publication
Financial Results (Standalone & Consolidated) For The Quarter And Year Ended 31St March 2026
30-May-2026 | Source : BSE1. Audited Financial Statement (Standalone & Consolidated) for the year ended 31st March 2026 2. Audited Financial Statement(Standalone & Consolidated) for the fourth quarter and ended 31st March 2026. 3.Auditors Report (Standalone & Consolidated) for the year ended 31st March 2026 4. Recommendation of final dividend @ 10 i.e. Rs 1/- per equity shares of Rs. 10 each for the year ended 31st March 2026
Board Meeting Outcome for Outcome Of Board Meeting Held On 30Th May 2026
30-May-2026 | Source : BSEIn terms of Regulation 30 33 and other applicable Regulations if any of the SEBI (Listing Obligations and Disclosure Requirements) Regulations 2015 this is to inform you that the Board of Directors of the Company in its meeting held today i.e. Saturday 30th May 2026 has inter-alia considered and approved the following: 1. Audited Financial Statements (Standalone & Consolidated) for the year ended 31st March 2026; 2. Audited Financial Results (Standalone & Consolidated) for the fourth quarter and year ended 31st March 2026; 3. Auditors Report (Standalone & Consolidated) for the year ended 31st March 2026. 4. Recommendation of final dividend @10% i.e. Re.1/- per equity share of Rs.10/- each for the year ended 31st March 2026.
Corporate Actions

No Upcoming Board Meetings

Competent Automobiles Company Ltd has declared 10% dividend, ex-date: 19 Sep 25

No Splits history available

No Bonus history available

No Rights history available
Quality key factors
Valuation key factors
Technicals key factors
 Technical Indicator Scale: Bearish, Mildly Bearish, Sideways, Mildly Bullish, Bullish Turned
 Shareholding Snapshot : Mar 2026
Shareholding Compare (%holding)
Promoters
None
Held by 0 Schemes
Held by 0 FIIs
Kavita Ahuja (61.48%)
Gujarat Lease Financing Limited (2.92%)
19.17%
Quarterly Results Snapshot (Consolidated) - Mar'26 - YoY

YoY Growth in quarter ended Mar 2026 is 20.09% vs 3.54% in Mar 2025
YoY Growth in quarter ended Mar 2026 is 16.89% vs -23.00% in Mar 2025
Half Yearly Results Snapshot (Standalone) - Sep'25
Growth in half year ended Sep 2025 is -0.57% vs -2.23% in Sep 2024

Growth in half year ended Sep 2025 is -31.42% vs -9.88% in Sep 2024
Nine Monthly Results Snapshot (Standalone) - Dec'25
YoY Growth in nine months ended Dec 2025 is 3.67% vs 0.25% in Dec 2024
YoY Growth in nine months ended Dec 2025 is 1.63% vs -21.45% in Dec 2024
Annual Results Snapshot (Consolidated) - Mar'26
YoY Growth in year ended Mar 2026 is 13.78% vs 1.04% in Mar 2025
YoY Growth in year ended Mar 2026 is -4.37% vs -21.99% in Mar 2025
About Competent Automobiles Company Ltd

Company Coordinates


