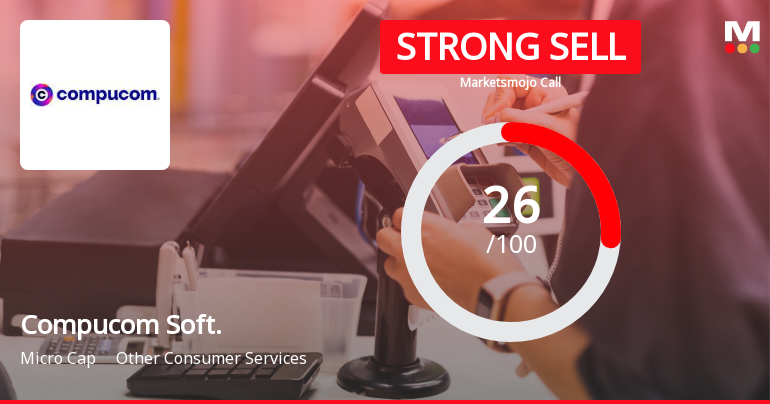
Compucom Soft.

  • Market Cap: Micro Cap
  • Industry: Other Consumer Services
  • ISIN: INE453B01029
  • NSEID: COMPUSOFT
  • BSEID: 532339
INR
13.44
-0.1 (-0.74%)
BSENSE

Sep 01, 03:30 PM

BSE+NSE Vol: 29.05 k

  • Price Points
  • Score
  • Mojo Parameters
  • Total Return
  • News and Corporate Actions
  • Key factors
  • Shareholding
  • Financials
  • CompanyCV
stock-summaryPrice Point
High/Low

1Day

52 Week

Valuation
Technical
Day's Volume

CASH

29.05 k (-4.04%) Volume

Shareholding (Jun 2026)

FII

0.00%

Held by 0 FIIs

DII

0.02%

Held by 0 DIIs

Promoter

71.60%

Why is Compucom Software Ltd falling/rising?

02-Sep-2026

As of 01-Sep, Compucom Software Ltd's stock price is at 13.44, down 0.74%, and has significantly underperformed the market with a 29.63% decline over the past year. The company faces financial challenges, including negative operating profits and a substantial drop in investor interest, leading to a strong sell recommendation.

As of 01-Sep, Compucom Software Ltd's stock price is falling, currently at 13.44, reflecting a change of -0.1 (-0.74%). The stock has shown consistent underperformance against the benchmark, with a decline of -29.63% over the past year, while the BSE500 index has only decreased by -4.26% during the same period. Additionally, the stock has generated a return of -41.31% over the last three years, indicating a significant lag behind the market.<BR><BR>Today's performance further highlights the stock's struggles, as it underperformed its sector by -0.41%. The moving averages suggest that while the stock is higher than its 5-day, 20-day, and 50-day averages, it remains lower than its 100-day and 200-day averages, indicating a lack of upward momentum. Furthermore, there has been a notable decline in investor participation, with delivery volume dropping by -34.84% compared to the 5-day average, which may signal waning interest from investors.<BR><BR>The company's financial health also raises concerns, as it has recorded negative operating profits, with an EBIT of Rs. -4.79 cr. The net sales for the most recent quarter fell by -5.4% compared to the previous four-quarter average, and the company has experienced a significant profit decline of -123.2% over the past year. These factors contribute to the perception of the stock as a strong sell, reflecting poor long-term growth prospects and increasing risk for investors.

View full answer

Who are in the management team of Compucom Soft.?

01-Sep-2026

The management team of Compucom Soft includes Surendra Kumar Surana (Executive Chairman & Managing Director), Vaibhav Surana (Whole Time Director), and several Non-Executive and Independent Directors, such as Ajay Kumar Surana and Baldev Singh. They are responsible for guiding the company's strategic direction and operations.

The management team of Compucom Soft includes the following individuals:<BR><BR>1. **Surendra Kumar Surana** - Executive Chairman & Managing Director<BR>2. **Vaibhav Surana** - Whole Time Director & Executive Director<BR>3. **Ajay Kumar Surana** - Non-Executive Director<BR>4. **Trishla Rampuriya** - Non-Executive Director<BR>5. **Baldev Singh** - Independent Director<BR>6. **Satyanarayan Vljeyverglya** - Independent Director<BR>7. **Amitabh Kaushik** - Independent Director<BR>8. **Staya Narayan Gupta** - Independent Director<BR><BR>This team plays a crucial role in guiding the company's strategic direction and operations.

View full answer

What does Compucom Soft. do?

01-Sep-2026

Compucom Software Ltd specializes in telecom and GIS software, operating as a micro-cap company since its incorporation in 1995. As of June 2026, it reported net sales of 8 Cr and a net profit of 1 Cr, with a market cap of INR 107 Cr.

Overview:<BR>Compucom Software Ltd operates in the offshore business areas of telecom software and GIS software/conversion, and it belongs to the micro-cap category within the Other Consumer Services industry.<BR><BR>History:<BR>Compucom Software Ltd was incorporated as a Private Limited Company in March 1995 and was originally known as Geotech Software Private Limited. The company changed its name to Compucom Software Private Limited in March 1999 and later converted into a Public Limited Company, acquiring its current name. The latest quarterly results reported net sales and net profit for June 2026.<BR><BR>Financial Snapshot:<BR>Net Sales: 8 Cr (Quarterly Results - Jun 2026) <BR>Net Profit: 1 Cr (Quarterly Results - Jun 2026) <BR>Market Cap: INR 107 Cr (Micro Cap)<BR><BR>Key Metrics:<BR>P/E: N/A <BR>Industry P/E: 18 <BR>Dividend Yield: 1.51% <BR>Debt Equity: 0.06 <BR>Return on Equity: 0.13% <BR>Price to Book: 0.74<BR><BR>Contact Details:<BR>Address: IT 14-15 EPIP, RIICO Industrial Area Sitapura Jaipur Rajasthan : 302022 <BR>Tel: 91-141-5115908(10 Lines) <BR>Email: investor@compucom.co.in <BR>Website: http://www.compucom.co.in

View full answer

Who are the peers of the Compucom Soft.?

01-Sep-2026

Compucom Soft.'s peers include Zee Learn, CP Capital, Golden Crest, VJTF Eduservices, Sodhani Academy, Ironwood Educa, Ascensive Educa., and Moxsh Overseas. Compucom Soft. has average management risk, below average growth, and a 1-year return of -28.66%, higher than Sodhani Academy but lower than Ironwood Educa's 23.06%.

Peers: The peers of Compucom Soft. are Zee Learn, CP Capital, Golden Crest, VJTF Eduservices, Sodhani Academy, Ironwood Educa, Ascensive Educa., and Moxsh Overseas.<BR><BR>Quality Snapshot: Below Average management risk is observed at Zee Learn, CP Capital, VJTF Eduservices, and Ironwood Educa, while Average management risk is found at Compucom Soft., Ascensive Educa., and Moxsh Overseas. Good growth is noted at CP Capital, Sodhani Academy, and Ascensive Educa., while Below Average growth is seen at Compucom Soft., VJTF Eduservices, and Moxsh Overseas. The Capital Structure is Excellent at CP Capital, Good at Compucom Soft., Sodhani Academy, and Average at Ascensive Educa., while Below Average is found at Zee Learn, VJTF Eduservices, Ironwood Educa, and Moxsh Overseas, and Golden Crest does not qualify.<BR><BR>Return Snapshot: The peer with the highest 1-year return is Ironwood Educa at 23.06%, while the lowest is Sodhani Academy at -45.47%. Compucom Soft.'s 1-year return is -28.66%, which is higher than Sodhani Academy's but lower than Ironwood Educa's. Additionally, peers with a negative six-month return include Compucom Soft., VJTF Eduservices, and Ascensive Educa.

View full answer

How big is Compucom Soft.?

01-Sep-2026

As of 31st August, Compucom Software Ltd has a market capitalization of 107.00 Cr, with recent net sales of 33.43 Cr and a net profit of 2.91 Cr. The company has shareholder's funds of 142.14 Cr and total assets of 201.49 Cr as of March 2026.

As of 31st August, Compucom Software Ltd has a market capitalization of 107.00 Cr, categorizing it as a Micro Cap company.<BR><BR>In the latest four quarters, Compucom Software Ltd reported Net Sales of 33.43 Cr and a Net Profit of 2.91 Cr.<BR><BR>For the latest annual period ending in March 2026, the company has Shareholder's Funds amounting to 142.14 Cr and Total Assets of 201.49 Cr.

View full answer

Should I buy, sell or hold Compucom Software Ltd?

07-Aug-2026

Are Compucom Software Ltd latest results good or bad?

02-Aug-2026

Compucom Software Ltd's latest results show improved profitability with a net profit increase of 25.69%, but revenue declined 8.09% year-on-year, raising concerns about sustainability due to heavy reliance on non-operating income. Overall, while there are positive signs, ongoing revenue challenges suggest caution for investors.

Compucom Software Ltd's latest results present a mixed picture. On the positive side, the company reported a net profit of ₹1.37 crore for Q1 FY27, which is a significant increase of 25.69% compared to the previous quarter and a slight improvement of 2.24% year-on-year. Additionally, the operating margin (excluding other income) saw a remarkable recovery, rising to 14.50% from a deeply negative position in the previous quarter, indicating effective cost management.<BR><BR>However, the revenue figures tell a different story. The company's revenue for the quarter was ₹8.07 crore, reflecting a modest sequential growth of 1.77% but a concerning year-on-year decline of 8.09%. This decline suggests ongoing challenges in generating new business and maintaining existing client relationships. Furthermore, the revenue is below the average of the past four quarters, indicating persistent volatility.<BR><BR>A critical concern is the heavy reliance on other income, which constituted an extraordinary 395.56% of profit before tax in this quarter. This raises questions about the sustainability of the reported earnings, as it suggests that the core business operations are not generating sufficient profit on their own.<BR><BR>Overall, while there are signs of improved profitability, the underlying revenue challenges and dependence on non-operating income cast a shadow over the results. Investors may need to be cautious, as the company appears to be managing profitability through cost control rather than through genuine revenue growth.

View full answer

When is the next results date for Compucom Software Ltd?

22-May-2026

The next results date for Compucom Software Ltd is 28 May 2026.

The next results date for Compucom Software Ltd is scheduled for 28 May 2026.

View full answer

Is Compucom Soft. overvalued or undervalued?

18-Nov-2025

As of November 17, 2025, Compucom Soft. is considered overvalued with a high PE ratio of 44.86 and an EV to EBIT of 142.82, significantly exceeding its peers NIIT Learning and Aptech, while also underperforming the Sensex with a 34.06% decline in the past year.

As of 17 November 2025, the valuation grade for Compucom Soft. has moved from very expensive to expensive. The company is currently considered overvalued based on its high PE ratio of 44.86, an EV to EBIT of 142.82, and a PEG ratio of 0.39, which suggests that despite the high earnings multiple, growth expectations are not being met. <BR><BR>In comparison to its peers, Compucom Soft. has a significantly higher PE ratio than NIIT Learning, which stands at 22.08, and Aptech, at 27.81, both of which are categorized as attractive. Additionally, the company's return over the past year has lagged behind the Sensex, with a decline of 34.06% compared to the index's gain of 9.50%. This further reinforces the view that Compucom Soft. is overvalued in its current market position.

View full answer

How has been the historical performance of Compucom Soft.?

13-Nov-2025

Compucom Soft experienced significant declines in net sales, operating income, and profits from March 2024 to March 2025, with net sales dropping from 70.32 Cr to 33.68 Cr. However, cash flow from operating activities improved to 36.00 Cr, indicating better cash management despite the overall financial challenges.

Answer:<BR>The historical performance of Compucom Soft shows significant fluctuations in key financial metrics over the years.<BR><BR>Breakdown:<BR>Compucom Soft's net sales peaked at 70.32 Cr in March 2024 but fell sharply to 33.68 Cr by March 2025. The total operating income followed a similar trend, decreasing from 70.32 Cr in March 2024 to 33.68 Cr in March 2025. Operating profit (PBDIT) also declined from 15.86 Cr in March 2024 to 12.29 Cr in March 2025, reflecting a decrease in profitability. Profit before tax dropped from 7.38 Cr in March 2024 to 2.37 Cr in March 2025, while profit after tax decreased from 5.59 Cr to 1.48 Cr in the same period. The company's total liabilities decreased from 202.54 Cr in March 2024 to 189.43 Cr in March 2025, indicating a reduction in debt levels. Total assets also fell from 202.54 Cr to 189.43 Cr. Cash flow from operating activities improved to 36.00 Cr in March 2025, contrasting with a negative cash flow of -33.00 Cr in March 2024, suggesting better cash management despite the decline in sales. Overall, the financial performance of Compucom Soft reflects a challenging year with significant revenue and profit declines, but improved cash flow from operations.

View full answer

What is the technical trend for Compucom Soft.?

09-Jun-2025

As of June 3, 2025, Compucom Soft's trend is sideways with mixed signals: weekly indicators are mildly bullish while monthly indicators show bearish tendencies, indicating a lack of strong directional momentum.

As of 3 June 2025, the technical trend for Compucom Soft has changed from mildly bearish to sideways. The current stance is neutral, with mixed signals across different time frames. The weekly MACD is mildly bullish, while the monthly MACD remains bearish. The weekly RSI shows no signal, but the monthly RSI is bullish. Bollinger Bands indicate a bullish trend weekly but mildly bearish monthly. Daily moving averages are mildly bearish, contrasting with the weekly and monthly KST and OBV, which are both mildly bullish. Overall, the indicators suggest a lack of strong directional momentum, leading to a sideways trend.

View full answer

Who are the top shareholders of the Compucom Soft.?

06-Jun-2025

The top shareholders of Compucom Soft include Compucom Technologies Pvt Ltd with 25.11%, followed by the Compucom Software Limited Employees Welfare Trust at 3.18%, and individual investors holding 23.1%. There are no mutual funds or foreign institutional investors currently involved.

The top shareholders of Compucom Soft include the promoters, with Compucom Technologies Pvt Ltd holding the largest stake at 25.11%. Additionally, the Compucom Software Limited Employees Welfare Trust is the highest public shareholder, owning 3.18%. Individual investors collectively hold 23.1% of the shares. Notably, there are no mutual funds or foreign institutional investors (FIIs) currently holding shares in the company.

View full answer

What is the bonus history of the Compucom Soft.?

06-Jun-2025

Compucom Soft has issued bonuses in the past, with the most recent being a 1:2 bonus on October 19, 2010, and a previous 1:1 bonus on December 24, 2008. These actions reflect the company's practice of rewarding shareholders with additional shares.

Compucom Soft has a history of bonus issues. The most recent bonus was a 1:2 bonus issue, which was announced with an ex-date of October 19, 2010, and a record date of October 20, 2010. Prior to that, the company issued a 1:1 bonus on December 26, 2008, with an ex-date of December 24, 2008. This indicates that Compucom Soft has engaged in bonus issues in the past, rewarding shareholders with additional shares.

View full answer

Has Compucom Soft. declared dividend?

06-Jun-2025

Compucom Software Ltd has declared a 20% dividend, amounting to 0.4 per share, with an ex-date of August 16, 2024. While recent short-term returns have been negative, longer-term performance shows positive trends, particularly over the last 4 and 5 years.

Compucom Software Ltd has declared a 20% dividend.<BR><BR>Dividend Details:<BR>- Percentage announced: 20%<BR>- Amount per share: 0.4<BR>- Ex-date: 16 Aug 24<BR><BR>Dividend Yield: 1.8%.<BR><BR>Total Returns by Period:<BR>In the last 6 months, the price return was -23.68%, with a dividend return of 0%, resulting in a total return of -23.68%.<BR><BR>Over the past year, the price return was -19.42%, while the dividend return contributed 1.33%, leading to a total return of -18.09%.<BR><BR>In the 2-year period, the price return was 10.32%, and the dividend return was 3.86%, culminating in a total return of 14.18%.<BR><BR>For the 3-year period, the price return was -0.49%, the dividend return was 4.84%, resulting in a total return of 4.35%.<BR><BR>In the last 4 years, the price return was 108.24%, with a dividend return of 10.17%, resulting in a total return of 118.41%.<BR><BR>Finally, over the past 5 years, the price return was 130.47%, and the dividend return was 20.52%, leading to a total return of 150.99%.<BR><BR>Overall, Compucom Software Ltd has declared a significant dividend, and while the short-term returns have been negative, the longer-term returns show a positive trend, particularly over the 4 and 5-year periods.

View full answer
iScoreScore
Click here to find our call on this stock
Strong Sell
Sell
Hold
Buy
Strong Buy

Dashboard

1

Poor long term growth as Net Sales has grown by an annual rate of 11.76% and Operating profit at 1.46% over the last 5 years

 
2

Negative results in Jun 26

3

Risky - Negative Operating Profits

4

Consistent Underperformance against the benchmark over the last 3 years

stock-summaryMojo Parameters

Mojo Parameters

Loading Valuation Snapshot...

Stock DNA

stock-summary
Industry

Other Consumer Services

stock-summary
Market cap

INR 107 Cr (Micro Cap)

stock-summary
P/E

NA (Loss Making)

stock-summary
Industry P/E

17

stock-summary
Dividend Yield

1.48%

stock-summary
Debt Equity

0.06

stock-summary
Return on Equity

0.13%

stock-summary
Price to Book

0.75

Revenue and Profits:
Net Sales:
8 Cr
(Quarterly Results - Jun 2026)
Net Profit:
1 Cr
stock-summaryTotal Returns
Total Returns (Price + Dividend) stock-summary
Dividend Yield (1.48%)
TimePeriod
Price Return
Dividend Return
Total Return
3 Months
-1.32%
1.75%
0.43%
6 Months
-5.35%
1.84%
-3.51%
1 Year
-29.63%
2.22%
-27.41%
2 Years
-56.95%
1.14%
-55.81%
3 Years
-41.31%
3.78%
-37.53%
4 Years
-47.4%
5.32%
-42.08%
5 Years
-3.31%
12.41%
9.1%

Latest dividend: 0.2 per share ex-dividend date: Sep-19-2025

Risk Adjusted Returns v/s stock-summary
Returns Beta
Icon
Beta has not been calculated since enough price history is not available
stock-summaryNews & Corporate Actions

News

Announcements stock-summary

Disclosure Under The Regulation 30 Of SEBI LODR Regarding Received Work Order

18-Aug-2026 | Source : BSE

We wish to inform you Compucom software Limited received a work order from Rajasthan skill and Livelihoods Development Corporation acting as a nodal agency for implimentation DDU-GKY.

Announcement under Regulation 30 (LODR)-Newspaper Publication

14-Aug-2026 | Source : BSE

Submission of Newspaper Publication after dispatch of 32nd Annual General Meeting Notice and Annual Report for FY 2025-26.

General Update _Revised

13-Aug-2026 | Source : BSE

Intimation of Dispatch of letter to those shareholders whose email id is not registered with company/RTA/Depository providing the weblink of companies website where the weblink of Annual Report for the FY 2025-26

Corporate Actions stock-summary

stock-summary
BOARD MEETING

No Upcoming Board Meetings

stock-summary
DIVIDEND

Compucom Software Ltd has declared 12% dividend, ex-date: 02 Sep 26

stock-summary
SPLITS

Compucom Software Ltd has announced 2:10 stock split, ex-date: 08 Oct 07

stock-summary
BONUS

Compucom Software Ltd has announced 1:2 bonus issue, ex-date: 19 Oct 10

stock-summary
RIGHTS

No Rights history available

stock-summaryKey Factors

Quality key factors stock-summary

Factor
Value
Sales Growth (5y)
11.76%
EBIT Growth (5y)
1.46%
EBIT to Interest (avg)
0.55
Debt to EBITDA (avg)
5.82
Net Debt to Equity (avg)
0.06
Sales to Capital Employed (avg)
0.28
Tax Ratio
32.79%
Dividend Payout Ratio
68.77%
Pledged Shares
0
Institutional Holding
0.02%
ROCE (avg)
1.69%
ROE (avg)
3.55%

Valuation key factors

Factor
Value
P/E Ratio
NA (Loss Making)
Industry P/E
17
Price to Book Value
0.75
EV to EBIT
-24.01
EV to EBITDA
78.23
EV to Capital Employed
0.76
EV to Sales
3.44
PEG Ratio
NA
Dividend Yield
1.49%
ROCE (Latest)
-2.29%
ROE (Latest)
0.13%

Technicals key factors

Indicator
Weekly
Monthly
MACD
Mildly Bullish
Bearish
RSI
No Signal
No Signal
Bollinger Bands
Sideways
Bearish
Moving Averages
Mildly Bearish (Daily)
KST
Mildly Bullish
Bearish
Dow Theory
No Trend
No Trend
OBV
No Trend
No Trend
stock-summary Technical Indicator Scale: Bearish, Mildly Bearish, Sideways, Mildly Bullish, Bullish  Turned 
stock-summaryShareholding
Shareholding Snapshot : Jun 2026stock-summary
Shareholding Compare (%holding) stock-summary
Majority shareholders

Promoters

Pledged Promoter Holdings

None

Mutual Funds

Held by 0 Schemes

FIIs

Held by 0 FIIs

Promoter with highest holding

Compucom Technologies Pvt Ltd (25.68%)

Highest Public shareholder

Compucom Software Limited Employees Welfare Trust (3.41%)

Individual Investors Holdings

22.46%

stock-summaryFinancial
[
  {
    "link": "quarterly",
    "btn_text": "All Quarterly Results",
    "header": "Quarterly Results Snapshot (Consolidated) - Jun'26 - QoQ",
    "rhs": [
      {
        "prefix": "Net Sales ",
        "suffix": "QoQ Growth in quarter ended Jun 2026 is 1.77% vs -11.50% in Mar 2026",
        "dir": 1
      },
      {
        "prefix": "Consolidated Net Profit ",
        "suffix": "QoQ Growth in quarter ended Jun 2026 is 25.69% vs 554.17% in Mar 2026",
        "dir": -1
      }
    ],
    "table": {
      "header": [
        "Jun'26",
        "Mar'26",
        "Change(%)"
      ],
      "body": [
        {
          "field": "Net Sales",
          "val1": "8.07",
          "val2": "7.93",
          "chgp": "1.77%",
          "chgp_class": "positive"
        },
        {
          "field": "Operating Profit (PBDIT) excl Other Income",
          "val1": "1.17",
          "val2": "-2.42",
          "chgp": "148.35%",
          "chgp_class": "positive"
        },
        {
          "field": "Interest",
          "val1": "0.84",
          "val2": "0.95",
          "chgp": "-11.58%",
          "chgp_class": "positive"
        },
        {
          "field": "Exceptional Items",
          "val1": "1.44",
          "val2": "4.33",
          "chgp": "-66.74%",
          "chgp_class": "negative"
        },
        {
          "field": "Consolidate Net Profit",
          "val1": "1.37",
          "val2": "1.09",
          "chgp": "25.69%",
          "chgp_class": "positive"
        },
        {
          "field": "Operating Profit Margin (Excl OI)",
          "val1": "14.50%",
          "val2": "-30.52%",
          "chgp": "45.02%",
          "chgp_class": "positive"
        }
      ]
    }
  },
  {
    "link": "half-yearly",
    "btn_text": "All Half Yearly Results",
    "header": "Half Yearly Results Snapshot (Consolidated) - Sep'25",
    "rhs": [
      {
        "prefix": "Net Sales ",
        "suffix": " Growth in half year ended Sep 2025 is 8.08% vs -59.26% in Sep 2024",
        "dir": 1
      },
      {
        "prefix": "Consolidated Net Profit ",
        "suffix": " Growth in half year ended Sep 2025 is 576.67% vs -92.70% in Sep 2024",
        "dir": 1
      }
    ],
    "table": {
      "header": [
        "Sep'25",
        "Sep'24",
        "Change(%)"
      ],
      "body": [
        {
          "field": "Net Sales",
          "val1": "17.25",
          "val2": "15.96",
          "chgp": "8.08%",
          "chgp_class": "positive"
        },
        {
          "field": "Operating Profit (PBDIT) excl Other Income",
          "val1": "3.82",
          "val2": "2.82",
          "chgp": "35.46%",
          "chgp_class": "positive"
        },
        {
          "field": "Interest",
          "val1": "1.09",
          "val2": "1.67",
          "chgp": "-34.73%",
          "chgp_class": "positive"
        },
        {
          "field": "Exceptional Items",
          "val1": "0.00",
          "val2": "0.00",
          "chgp": "",
          "chgp_class": "neutral"
        },
        {
          "field": "Consolidate Net Profit",
          "val1": "2.03",
          "val2": "0.30",
          "chgp": "576.67%",
          "chgp_class": "positive"
        },
        {
          "field": "Operating Profit Margin (Excl OI)",
          "val1": "22.14%",
          "val2": "17.67%",
          "chgp": "4.47%",
          "chgp_class": "positive"
        }
      ]
    }
  },
  {
    "link": "nine-monthly",
    "btn_text": "All Nine Monthly Results",
    "header": "Nine Monthly Results Snapshot (Consolidated) - Dec'25",
    "rhs": [
      {
        "prefix": "Net Sales ",
        "suffix": "YoY Growth in nine months ended Dec 2025 is 8.89% vs -61.10% in Dec 2024",
        "dir": 1
      },
      {
        "prefix": "Consolidated Net Profit ",
        "suffix": "YoY Growth in nine months ended Dec 2025 is 184.13% vs -87.70% in Dec 2024",
        "dir": 1
      }
    ],
    "table": {
      "header": [
        "Dec'25",
        "Dec'24",
        "Change(%)"
      ],
      "body": [
        {
          "field": "Net Sales",
          "val1": "26.21",
          "val2": "24.07",
          "chgp": "8.89%",
          "chgp_class": "positive"
        },
        {
          "field": "Operating Profit (PBDIT) excl Other Income",
          "val1": "5.01",
          "val2": "4.34",
          "chgp": "15.44%",
          "chgp_class": "positive"
        },
        {
          "field": "Interest",
          "val1": "2.02",
          "val2": "2.91",
          "chgp": "-30.58%",
          "chgp_class": "positive"
        },
        {
          "field": "Exceptional Items",
          "val1": "-0.46",
          "val2": "0.00",
          "chgp": "",
          "chgp_class": "neutral"
        },
        {
          "field": "Consolidate Net Profit",
          "val1": "1.79",
          "val2": "0.63",
          "chgp": "184.13%",
          "chgp_class": "positive"
        },
        {
          "field": "Operating Profit Margin (Excl OI)",
          "val1": "19.11%",
          "val2": "18.03%",
          "chgp": "1.08%",
          "chgp_class": "positive"
        }
      ]
    }
  },
  {
    "link": "annual",
    "btn_text": "All Annual Results",
    "header": "Annual Results Snapshot (Consolidated) - Mar'26",
    "rhs": [
      {
        "prefix": "Net Sales ",
        "suffix": "YoY Growth in year ended Mar 2026 is 1.37% vs -52.10% in Mar 2025",
        "dir": 1
      },
      {
        "prefix": "Consolidated Net Profit ",
        "suffix": "YoY Growth in year ended Mar 2026 is 94.59% vs -72.13% in Mar 2025",
        "dir": 1
      }
    ],
    "table": {
      "header": [
        "Mar'26",
        "Mar'25",
        "Change(%)"
      ],
      "body": [
        {
          "field": "Net Sales",
          "val1": "34.14",
          "val2": "33.68",
          "chgp": "1.37%",
          "chgp_class": "positive"
        },
        {
          "field": "Operating Profit (PBDIT) excl Other Income",
          "val1": "2.57",
          "val2": "5.87",
          "chgp": "-56.22%",
          "chgp_class": "negative"
        },
        {
          "field": "Interest",
          "val1": "2.98",
          "val2": "3.83",
          "chgp": "-22.19%",
          "chgp_class": "positive"
        },
        {
          "field": "Exceptional Items",
          "val1": "3.87",
          "val2": "0.00",
          "chgp": "",
          "chgp_class": "neutral"
        },
        {
          "field": "Consolidate Net Profit",
          "val1": "2.88",
          "val2": "1.48",
          "chgp": "94.59%",
          "chgp_class": "positive"
        },
        {
          "field": "Operating Profit Margin (Excl OI)",
          "val1": "7.53%",
          "val2": "17.43%",
          "chgp": "-9.90%",
          "chgp_class": "negative"
        }
      ]
    }
  }
]

Quarterly Results Snapshot (Consolidated) - Jun'26 - QoQstock-summary

Jun'26
Mar'26
Change(%)
Net Sales
8.07
7.93
1.77%
Operating Profit (PBDIT) excl Other Income
1.17
-2.42
148.35%
Interest
0.84
0.95
-11.58%
Exceptional Items
1.44
4.33
-66.74%
Consolidate Net Profit
1.37
1.09
25.69%
Operating Profit Margin (Excl OI)
14.50%
-30.52%
45.02%
Values in Rs Cr.
Direction Arrows
Net Sales

QoQ Growth in quarter ended Jun 2026 is 1.77% vs -11.50% in Mar 2026

Direction Arrows
Consolidated Net Profit

QoQ Growth in quarter ended Jun 2026 is 25.69% vs 554.17% in Mar 2026

Half Yearly Results Snapshot (Consolidated) - Sep'25stock-summary

Sep'25
Sep'24
Change(%)
Net Sales
17.25
15.96
8.08%
Operating Profit (PBDIT) excl Other Income
3.82
2.82
35.46%
Interest
1.09
1.67
-34.73%
Exceptional Items
0.00
0.00
Consolidate Net Profit
2.03
0.30
576.67%
Operating Profit Margin (Excl OI)
22.14%
17.67%
4.47%
Values in Rs Cr.
Direction Arrows
Net Sales

Growth in half year ended Sep 2025 is 8.08% vs -59.26% in Sep 2024

Direction Arrows
Consolidated Net Profit

Growth in half year ended Sep 2025 is 576.67% vs -92.70% in Sep 2024

Nine Monthly Results Snapshot (Consolidated) - Dec'25stock-summary

Dec'25
Dec'24
Change(%)
Net Sales
26.21
24.07
8.89%
Operating Profit (PBDIT) excl Other Income
5.01
4.34
15.44%
Interest
2.02
2.91
-30.58%
Exceptional Items
-0.46
0.00
Consolidate Net Profit
1.79
0.63
184.13%
Operating Profit Margin (Excl OI)
19.11%
18.03%
1.08%
Values in Rs Cr.
Direction Arrows
Net Sales

YoY Growth in nine months ended Dec 2025 is 8.89% vs -61.10% in Dec 2024

Direction Arrows
Consolidated Net Profit

YoY Growth in nine months ended Dec 2025 is 184.13% vs -87.70% in Dec 2024

Annual Results Snapshot (Consolidated) - Mar'26stock-summary

Mar'26
Mar'25
Change(%)
Net Sales
34.14
33.68
1.37%
Operating Profit (PBDIT) excl Other Income
2.57
5.87
-56.22%
Interest
2.98
3.83
-22.19%
Exceptional Items
3.87
0.00
Consolidate Net Profit
2.88
1.48
94.59%
Operating Profit Margin (Excl OI)
7.53%
17.43%
-9.90%
Values in Rs Cr.
Direction Arrows
Net Sales

YoY Growth in year ended Mar 2026 is 1.37% vs -52.10% in Mar 2025

Direction Arrows
Consolidated Net Profit

YoY Growth in year ended Mar 2026 is 94.59% vs -72.13% in Mar 2025

stock-summaryCompany CV
About Compucom Software Ltd stock-summary
stock-summary
Compucom Software Ltd
Micro Cap
Other Consumer Services
Compucom Software Limited (Formerly known Geotech Software Private Limited) was incorporated as a Private Limited Company in March, 1995. The Company's name was later changed to "Compucom Software Private Limited" in March, 1999. Subsequently, the Company converted into a Public Limited Company and acquired its present name, "Compucom Software Limited". CSL's main activities are in the offshore business areas of telecom software and GIS software/conversion.
Company Coordinates stock-summary
Company Details
IT 14-15 EPIP, RIICO Industrial Area Sitapura Jaipur Rajasthan : 302022
stock-summary
Tel: 91-141-5115908(10 Lines)
stock-summary
investor@compucom.co.in
Registrar Details
MCS Ltd , F-65, , Okhla Industrial Area, Phase - I, New Delhi