
Compare Compucom Soft. with Similar Stocks
Stock DNA
Other Consumer Services
INR 109 Cr (Micro Cap)
601.00
19
1.44%
0.06
0.13%
0.77
Total Returns (Price + Dividend) 
Latest dividend: 0.2 per share ex-dividend date: Sep-19-2025
Risk Adjusted Returns v/s
Returns Beta

News

Compucom Software Ltd is Rated Strong Sell
Compucom Software Ltd is rated Strong Sell by MarketsMOJO, with this rating last updated on 29 May 2026. However, the analysis and financial metrics discussed here reflect the company’s current position as of 01 June 2026, providing investors with the most up-to-date view of the stock’s fundamentals, returns, and overall outlook.
Read full news article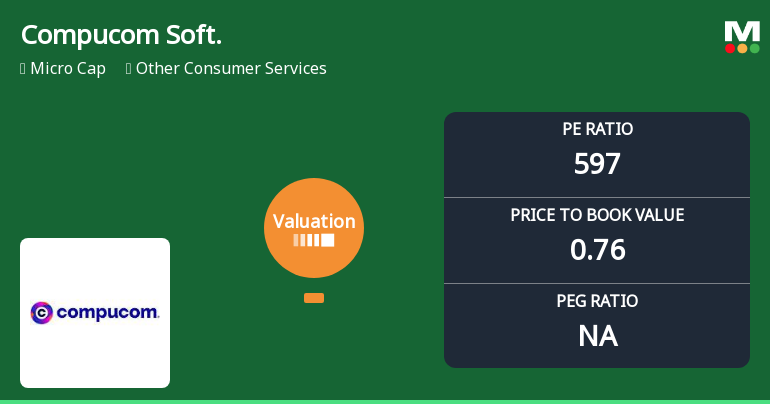
Compucom Software Ltd Valuation Shifts Signal Heightened Risk Amid Market Underperformance
Compucom Software Ltd, a micro-cap player in the Other Consumer Services sector, has seen a marked deterioration in its valuation parameters, raising concerns about its price attractiveness. With a sky-high price-to-earnings (P/E) ratio of 596.94 and a price-to-book value (P/BV) of 0.76, the stock’s valuation grade has shifted from fair to risky, prompting a downgrade in its Mojo Grade to Strong Sell as of 29 Nov 2024.
Read full news articleAre Compucom Software Ltd latest results good or bad?
Compucom Software Ltd's latest financial results for Q4 FY26 reveal a complex picture marked by significant operational challenges. The company reported a net profit of ₹1.09 crore, which reflects a year-on-year increase of 28.24%. However, this profit was heavily reliant on other income, which accounted for a substantial portion of total revenue. Without this non-operating income of ₹2.19 crores, the company would have faced a pre-tax loss, indicating a fragile core business performance. Revenue for the quarter was ₹7.93 crores, representing a decline of 17.48% year-on-year and 11.50% quarter-on-quarter, marking the lowest revenue figure recorded in the available dataset. This persistent revenue decline raises concerns about the company's ability to generate sustainable business. Additionally, the operating margin excluding other income plummeted to negative 30.52%, the worst performance on record, highli...
Read full news article Announcements
Report On Special Window For Re-Lodgement Of Transfer Requests Of Physical Shares.
09-Jun-2026 | Source : BSEAs per SEBI circular dated January 30 2026 introduce a Special Window for physical shareholder for transfer and Dematerialize of physical shares regarding this a report summited.
Intimation To Furnish PAN KYC Details Bank Account Details And Nomination By Shareholders Holding Physical Shares.
06-Jun-2026 | Source : BSEAs per SEBI Master circular for RTA the Company dispatch intimation letter to physical shareholder furnish their PAN KYC and Nominee details to RTA of the Company.
Announcement under Regulation 30 (LODR)-Newspaper Publication
29-May-2026 | Source : BSESubmission of Copy of Newspaper Publication regarding Audited Financial Results of the Company for the Quarter & Year Ended on 31st March 2026
Corporate Actions

No Upcoming Board Meetings

Compucom Software Ltd has declared 10% dividend, ex-date: 19 Sep 25

Compucom Software Ltd has announced 2:10 stock split, ex-date: 08 Oct 07

Compucom Software Ltd has announced 1:2 bonus issue, ex-date: 19 Oct 10

No Rights history available
Quality key factors
Valuation key factors
Technicals key factors
 Technical Indicator Scale: Bearish, Mildly Bearish, Sideways, Mildly Bullish, Bullish Turned
 Shareholding Snapshot : Mar 2026
Shareholding Compare (%holding)
Promoters
None
Held by 0 Schemes
Held by 0 FIIs
Compucom Technologies Pvt Ltd (25.19%)
Compucom Software Limited Employees Welfare Trust (3.41%)
22.6%
Quarterly Results Snapshot (Consolidated) - Mar'26 - QoQ

QoQ Growth in quarter ended Mar 2026 is -11.50% vs 5.79% in Dec 2025

QoQ Growth in quarter ended Mar 2026 is 554.17% vs -134.78% in Dec 2025
Half Yearly Results Snapshot (Consolidated) - Sep'25
Growth in half year ended Sep 2025 is 8.08% vs -59.26% in Sep 2024
Growth in half year ended Sep 2025 is 576.67% vs -92.70% in Sep 2024
Nine Monthly Results Snapshot (Consolidated) - Dec'25
YoY Growth in nine months ended Dec 2025 is 8.89% vs -61.10% in Dec 2024
YoY Growth in nine months ended Dec 2025 is 184.13% vs -87.70% in Dec 2024
Annual Results Snapshot (Consolidated) - Mar'26
YoY Growth in year ended Mar 2026 is 1.37% vs -52.10% in Mar 2025
YoY Growth in year ended Mar 2026 is 94.59% vs -72.13% in Mar 2025
About Compucom Software Ltd

Company Coordinates


