
Compare Conart Engineers with Similar Stocks
Total Returns (Price + Dividend) 
Latest dividend: 1 per share ex-dividend date: Nov-20-2019
Risk Adjusted Returns v/s
Returns Beta

News
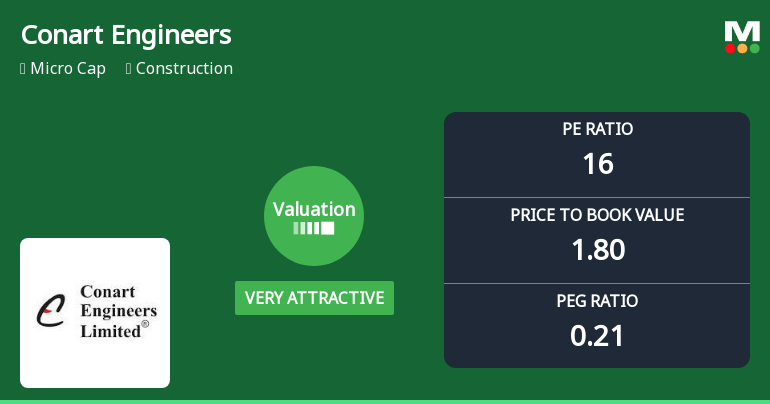
Conart Engineers Ltd Valuation Shifts Signal Renewed Price Attractiveness
Conart Engineers Ltd has seen a significant shift in its valuation parameters, moving from an attractive to a very attractive rating despite a sharp decline in its share price. This change reflects a notable adjustment in key metrics such as the price-to-earnings (P/E) and price-to-book value (P/BV) ratios, positioning the micro-cap construction firm as a compelling value proposition relative to its peers and historical benchmarks.
Read full news articleAre Conart Engineers Ltd latest results good or bad?
Conart Engineers Ltd's latest financial results for Q4 FY26 present a mixed operational picture. The company reported a net profit of ₹1.11 crores, reflecting a significant quarter-on-quarter growth of 81.97%. This improvement in profitability was primarily driven by a lower effective tax rate, which dropped to 5.13% from the previous quarter's 24.69%. However, the revenue for the quarter remained unchanged at ₹15.61 crores compared to the previous quarter, indicating a stagnation in sales performance. This figure also represents a notable year-on-year decline of 28.66% from ₹21.88 crores in Q4 FY25, highlighting potential challenges in order book execution or market demand. The profit after tax margin improved to 7.11%, up from 3.91% in the prior quarter, suggesting better profitability metrics, albeit influenced by tax benefits rather than operational enhancements. Conversely, the operating margin, exclu...
Read full news article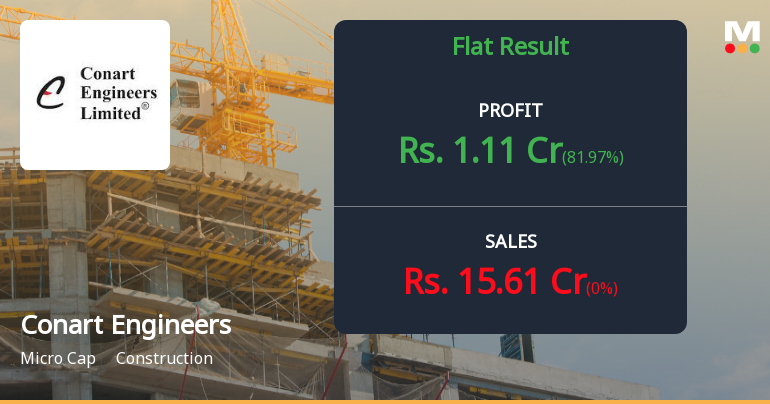
Conart Engineers Q4 FY26: Profit Surge Masks Revenue Decline Concerns
Conart Engineers Ltd., a Mumbai-based construction company, posted a net profit of ₹1.11 crores in Q4 FY26, marking an impressive 81.82% surge from the previous quarter's ₹0.61 crores. However, this profit growth comes against a backdrop of stagnant quarterly revenue and a concerning 28.66% year-on-year sales decline, raising questions about the sustainability of the company's earnings trajectory. The stock, currently trading at ₹106.80 with a market capitalisation of ₹69.00 crores, has declined 3.65% following the results announcement.
Read full news article Announcements
Compliances-Reg.24(A)-Annual Secretarial Compliance
30-May-2026 | Source : BSEAnnual Secretarial Compliance Report for the Financial year ended on 31.03.2026
Audited Financial Results Of The Company For The Quarter And Year Ended On 31St March 2026
30-May-2026 | Source : BSEAudited financial results of the company for the quarter and year ended on 31st March 2026
Board Meeting Outcome for Outcome Of Board Meeting Held On 30Th May 2026
30-May-2026 | Source : BSEOutcome of Board Meeting held on Saturday 30th May 2026 inter alia consider and approve the Audited Financial Results of the Company for the quarter and year ended on 31st March 2026 as recommended by Audit Committee together with the Statements of Assets & Liabilities Cash Flow Statement and a copy of Auditors Report dated 30th May 2026 of the Statutory Auditors in respect of Audited Financial Results for the quarter and year ended on 31st March 2026.
Corporate Actions

No Upcoming Board Meetings

Conart Engineers Ltd has declared 10% dividend, ex-date: 20 Nov 19

Conart Engineers Ltd has announced 5:10 stock split, ex-date: 18 Feb 25

No Bonus history available

No Rights history available
Quality key factors
Valuation key factors
Technicals key factors
 Technical Indicator Scale: Bearish, Mildly Bearish, Sideways, Mildly Bullish, Bullish Turned
 Shareholding Snapshot : Mar 2026
Shareholding Compare (%holding)
Non Institution
None
Held by 0 Schemes
Held by 0 FIIs
Jimish Jitendra Sura (21.11%)
Dhairyashil Narayanarav Chate (10.83%)
47.71%
Quarterly Results Snapshot (Standalone) - Mar'26 - QoQ

QoQ Growth in quarter ended Mar 2026 is 0.00% vs -3.82% in Dec 2025
QoQ Growth in quarter ended Mar 2026 is 81.97% vs -52.71% in Dec 2025
Half Yearly Results Snapshot (Standalone) - Sep'25
Growth in half year ended Sep 2025 is 51.29% vs 0.84% in Sep 2024
Growth in half year ended Sep 2025 is 64.75% vs 35.56% in Sep 2024
Nine Monthly Results Snapshot (Standalone) - Dec'25
YoY Growth in nine months ended Dec 2025 is 34.52% vs 1.64% in Dec 2024
YoY Growth in nine months ended Dec 2025 is 83.22% vs -30.58% in Dec 2024
Annual Results Snapshot (Standalone) - Mar'26

YoY Growth in year ended Mar 2026 is 10.08% vs 15.63% in Mar 2025
YoY Growth in year ended Mar 2026 is 39.18% vs -12.99% in Mar 2025
About Conart Engineers Ltd

Company Coordinates


