
Compare C C C L with Similar Stocks
Dashboard
With a Operating Losses, the company has a Weak Long Term Fundamental Strength
- Poor long term growth as Net Sales has grown by an annual rate of 4.88% and Operating profit at 7.97% over the last 5 years
- Low ability to service debt as the company has a high Debt to EBITDA ratio of -0.01 times
Risky - Negative EBITDA
Despite the size of the company, domestic mutual funds hold only 0% of the company
Stock DNA
Realty
INR 668 Cr (Micro Cap)
NA (Loss Making)
43
0.00%
-0.47
-3.70%
2.36
Total Returns (Price + Dividend) 
Latest dividend: 0.5 per share ex-dividend date: Jun-16-2011
Risk Adjusted Returns v/s
Returns Beta

News

Consolidated Construction Consortium Ltd Faces Bearish Momentum Amid Technical Downturn
Consolidated Construction Consortium Ltd (CCCL), a micro-cap player in the Realty sector, has experienced a notable shift in its technical momentum, moving from mildly bearish to a more pronounced bearish stance. Recent technical indicators including MACD, RSI, and moving averages signal increasing downside pressure, reflecting a challenging environment for the stock amid broader market volatility.
Read full news article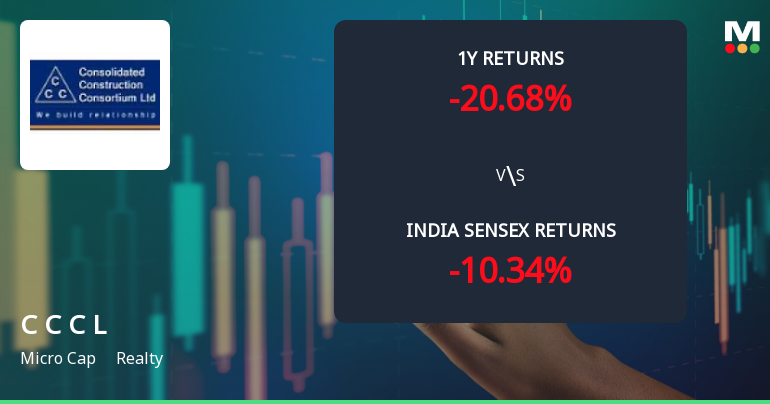
Consolidated Construction Consortium Ltd Technical Momentum Shifts Amid Mixed Market Signals
Consolidated Construction Consortium Ltd (CCCL), a micro-cap player in the Realty sector, has experienced a nuanced shift in its technical momentum, reflecting a complex interplay of bearish and mildly bullish signals across key indicators. Despite a recent upgrade from a Sell to a Strong Sell rating by MarketsMOJO on 22 Dec 2025, the stock’s price action and technical parameters suggest a cautious outlook for investors navigating this micro-cap’s volatile terrain.
Read full news article
Consolidated Construction Consortium Ltd is Rated Strong Sell
Consolidated Construction Consortium Ltd is rated Strong Sell by MarketsMOJO. This rating was last updated on 22 December 2025. However, the analysis and financial metrics discussed below reflect the stock’s current position as of 09 June 2026, providing investors with an up-to-date view of the company’s fundamentals, returns, and market standing.
Read full news article Announcements
Updates
17-Sep-2019 | Source : NSE
| Consolidated Construction Consortium Limited has informed the Exchange regarding 'Revised filing of Share holding pattern'. |
AGM\/Book Closure
29-Aug-2019 | Source : NSE
| Consolidated Construction Consortium Limited has informed the Exchange that the Register of Members & Share Transfer Books of the Company will remain closed from September 24, 2019 to September 30, 2019 ( both days inclusive) for the purpose of Annual General Meeting to be held on September 30,2019. |
Outcome of Board Meeting
28-Aug-2019 | Source : NSE
| Consolidated Construction Consortium Limited has informed the Exchange regarding Board meeting held on August 28, 2019 |
Corporate Actions

No Upcoming Board Meetings

Consolidated Construction Consortium Ltd has declared 25% dividend, ex-date: 16 Jun 11

Consolidated Construction Consortium Ltd has announced 2:10 stock split, ex-date: 10 Feb 10

No Bonus history available

No Rights history available
Quality key factors
Valuation key factors
Technicals key factors
 Technical Indicator Scale: Bearish, Mildly Bearish, Sideways, Mildly Bullish, Bullish Turned
 Shareholding Snapshot : Mar 2026
Shareholding Compare (%holding)
Promoters
None
Held by 0 Schemes
Held by 2 FIIs (0.04%)
Sarabeswar. R . (31.59%)
Icici Bank Ltd (8.91%)
20.05%
Quarterly Results Snapshot (Consolidated) - Mar'26 - QoQ

QoQ Growth in quarter ended Mar 2026 is 39.20% vs 12.23% in Dec 2025

QoQ Growth in quarter ended Mar 2026 is -156.82% vs 918.60% in Dec 2025
Half Yearly Results Snapshot (Consolidated) - Sep'25
Growth in half year ended Sep 2025 is 38.33% vs 48.00% in Sep 2024
Growth in half year ended Sep 2025 is 78.14% vs 195.63% in Sep 2024
Nine Monthly Results Snapshot (Consolidated) - Dec'25
YoY Growth in nine months ended Dec 2025 is 39.77% vs 35.72% in Dec 2024
YoY Growth in nine months ended Dec 2025 is 155.45% vs 104.78% in Dec 2024
Annual Results Snapshot (Consolidated) - Mar'26
YoY Growth in year ended Mar 2026 is 61.94% vs 39.11% in Mar 2025
YoY Growth in year ended Mar 2026 is -9.84% vs -86.97% in Mar 2025
About Consolidated Construction Consortium Ltd

Company Coordinates


