
Compare Constellium SE with Similar Stocks
Dashboard
High Debt Company with a Debt to Equity ratio (avg) at times
- Poor long term growth as Operating profit has grown by an annual rate 4.23% of over the last 5 years
- High Debt Company with a Debt to Equity ratio (avg) at times
The company has declared positive results in Mar'2025 after 2 consecutive negative quarters
With ROCE of 11.25%, it has a expensive valuation with a 1.43 Enterprise value to Capital Employed
Market Beating Performance
Total Returns (Price + Dividend) 
Constellium SE for the last several years.
Risk Adjusted Returns v/s
News
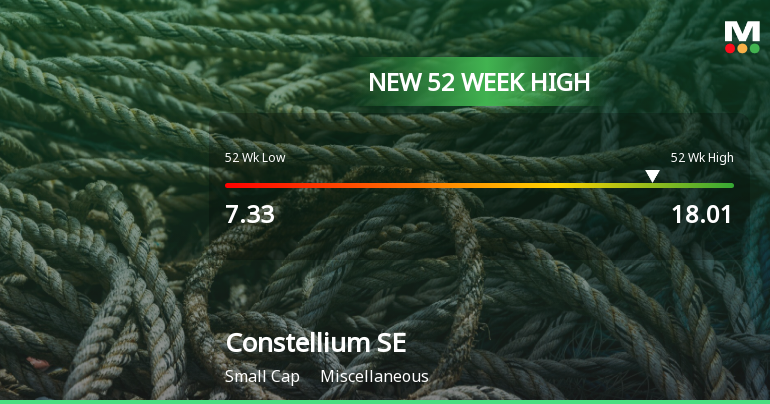
Constellium SE Hits New 52-Week High of USD 18.01
Constellium SE achieved a new 52-week high of USD 18.01 on October 29, 2025, despite a one-year decline of 19.46%. The company, with a market cap of USD 2,000 million, has a P/E ratio of 21.00 and a debt-to-equity ratio of 2.45, indicating substantial debt reliance.
Read full news article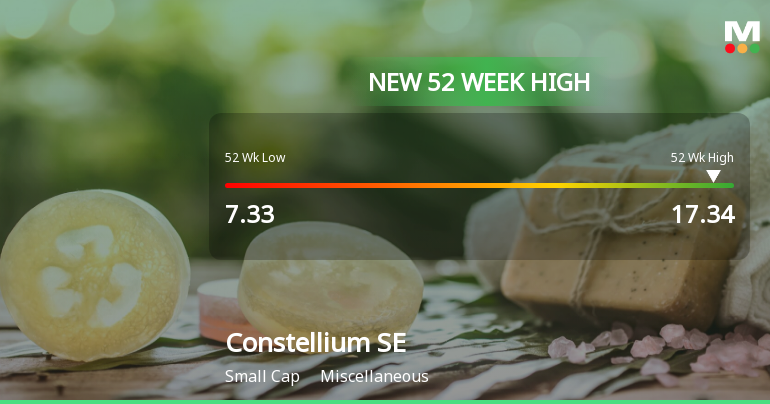
Constellium SE Hits New 52-Week High at USD 17.34
Constellium SE achieved a new 52-week high of USD 17.34 on October 24, 2025, following a low of USD 7.33. Despite a one-year performance decline of 16.34%, the company, with a market cap of USD 2 billion, shows a P/E ratio of 21.00 and a debt-to-equity ratio of 2.45.
Read full news article Announcements

Corporate Actions
Quality key factors
Valuation key factors
Technicals key factors
 Technical Indicator Scale: Bearish, Mildly Bearish, Sideways, Mildly Bullish, Bullish Turned
 Shareholding Snapshot : Mar 2025
Shareholding Compare (%holding)
Domestic Funds
Held in 65 Schemes (44.57%)
Held by 92 Foreign Institutions (15.94%)
Quarterly Results Snapshot (Consolidated) - Jun'25 - QoQ

QoQ Growth in quarter ended Jun 2025 is 6.27% vs 14.99% in Mar 2025
QoQ Growth in quarter ended Jun 2025 is -5.26% vs 180.85% in Mar 2025
Annual Results Snapshot (Consolidated) - Dec'24

YoY Growth in year ended Dec 2024 is -6.27% vs -8.39% in Dec 2023
YoY Growth in year ended Dec 2024 is -61.78% vs -51.50% in Dec 2023
About Constellium SE

Company Coordinates


