
Compare Constronics with Similar Stocks
Stock DNA
Trading & Distributors
INR 58 Cr (Micro Cap)
21.00
22
0.00%
-0.17
8.01%
1.52
Total Returns (Price + Dividend) 
Constronics for the last several years.
Risk Adjusted Returns v/s
Returns Beta

News
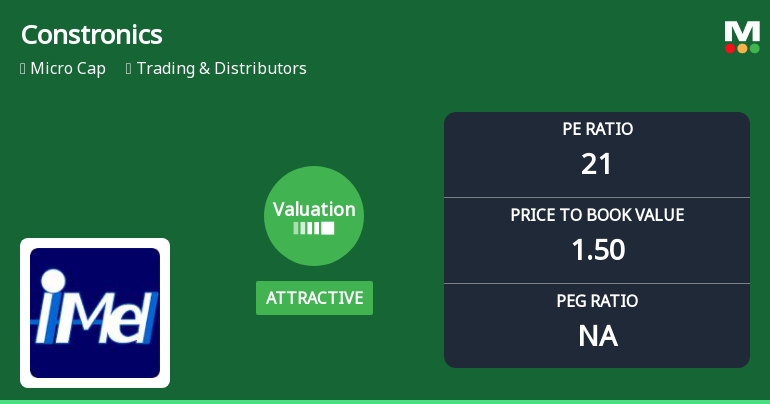
Constronics Infra Ltd Valuation Shifts Signal Changing Market Perception
Constronics Infra Ltd, a micro-cap player in the Trading & Distributors sector, has seen its valuation parameters improve from very attractive to attractive, signalling a notable shift in price attractiveness despite recent underperformance relative to the broader market. This article analyses the company’s updated valuation metrics, compares them with peers, and assesses the implications for investors amid a challenging market backdrop.
Read full news article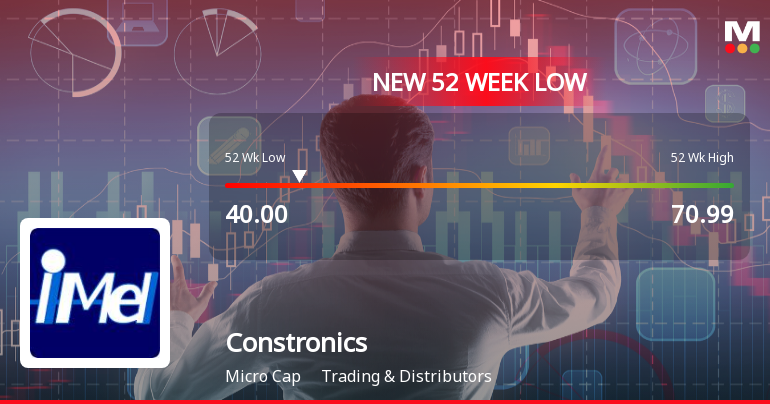
Markets Rally, But Constronics Infra Ltd Sinks to 52-Week Low in Stock-Specific Sell-Off
Despite a broader market rally, Constronics Infra Ltd has plunged to a fresh 52-week low of Rs 40 on 2 Jun 2026, marking a stark divergence from the overall market trend and signalling persistent headwinds for the micro-cap stock.
Read full news article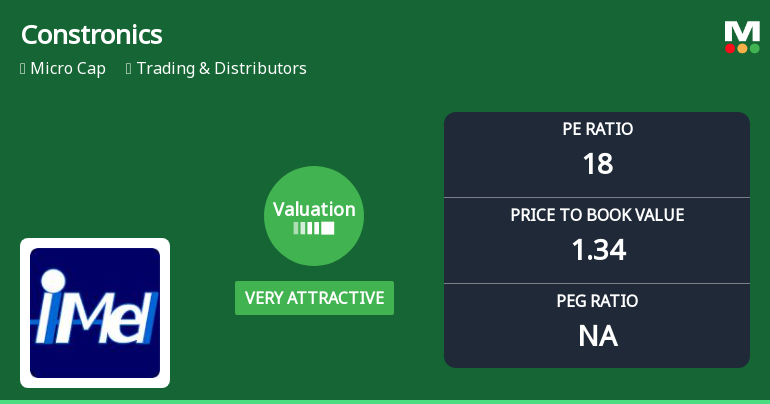
Constronics Infra Ltd Valuation Shifts Signal Renewed Price Attractiveness Amid Market Challenges
Constronics Infra Ltd, a micro-cap player in the Trading & Distributors sector, has witnessed a marked shift in its valuation parameters, moving from an attractive to a very attractive rating despite ongoing market headwinds. This change comes amid a significant price correction and a deteriorating market sentiment, reflected in a 6.45% drop in the stock price on 2 June 2026. Investors are now reassessing the stock’s price-to-earnings (P/E) and price-to-book value (P/BV) ratios in the context of its historical performance and peer comparisons.
Read full news article Announcements
Compliances-Reg.24(A)-Annual Secretarial Compliance
30-May-2026 | Source : BSEAnnual Secretarial Compliance report pursuant to Regulation 24A of SEBI (LODR) Regulations 2015
Financial Results For The Quarter And Year Ended 31St March 2026
29-May-2026 | Source : BSEFinancial results for the Quarter and year ended 31st March 2026
Board Meeting Outcome for Outcome Of The Board Meeting
29-May-2026 | Source : BSEOutcome of the Board meeting held on 29th May 2026 for the considering financials results for the Quarter and Year Ended 31st March 2026.
Corporate Actions

No Upcoming Board Meetings

No Dividend history available

No Splits history available

No Bonus history available

No Rights history available
Quality key factors
Valuation key factors
Technicals key factors
 Technical Indicator Scale: Bearish, Mildly Bearish, Sideways, Mildly Bullish, Bullish Turned
 Shareholding Snapshot : Mar 2026
Shareholding Compare (%holding)
Non Institution
99.9925
Held by 0 Schemes
Held by 0 FIIs
Vishnu Vardhan (10.63%)
Arulsundaram Nithya (12.33%)
72.61%
Quarterly Results Snapshot (Standalone) - Mar'26 - YoY

YoY Growth in quarter ended Mar 2026 is -61.20% vs 4,507.50% in Mar 2025
YoY Growth in quarter ended Mar 2026 is -75.49% vs 59.38% in Mar 2025
Half Yearly Results Snapshot (Standalone) - Sep'25
Growth in half year ended Sep 2025 is 94.30% vs 8,240.00% in Sep 2024
Growth in half year ended Sep 2025 is 109.48% vs 3,766.67% in Sep 2024
Nine Monthly Results Snapshot (Standalone) - Dec'25
YoY Growth in nine months ended Dec 2025 is 27.37% vs 9,200.00% in Dec 2024
YoY Growth in nine months ended Dec 2025 is 34.91% vs 2,550.00% in Dec 2024
Annual Results Snapshot (Standalone) - Mar'26
YoY Growth in year ended Mar 2026 is -4.63% vs 6,519.48% in Mar 2025
YoY Growth in year ended Mar 2026 is -0.64% vs 334.72% in Mar 2025
About Constronics Infra Ltd

Company Coordinates


