
Compare Containerway Int with Similar Stocks
Dashboard
With a Operating Losses, the company has a Weak Long Term Fundamental Strength
- Company's ability to service its debt is weak with a poor EBIT to Interest (avg) ratio of -0.98
- The company has been able to generate a Return on Equity (avg) of 1.17% signifying low profitability per unit of shareholders funds
Flat results in Mar 26
Risky - Negative EBITDA
Stock DNA
Transport Services
INR 21 Cr (Micro Cap)
NA (Loss Making)
24
0.00%
0.29
-16.65%
1.55
Total Returns (Price + Dividend) 
Containerway Int for the last several years.
Risk Adjusted Returns v/s
Returns Beta

News
Are Containerway International Ltd latest results good or bad?
Containerway International Ltd's latest financial results for Q4 FY26 reflect significant operational challenges and a deteriorating business environment. The company reported net sales of ₹2.19 crores, which represents a substantial year-on-year decline of 71.96% from ₹7.81 crores in Q4 FY25. This decline is indicative of severe revenue contraction, with a sequential drop of 45.66% from ₹4.03 crores in Q3 FY26, marking the lowest quarterly revenue in the available data series. The profitability metrics further illustrate the company's distress, with a net profit of -₹0.24 crores compared to a profit of ₹0.02 crores in the previous quarter. The operating margin turned sharply negative at -15.53%, a significant decline from the marginally positive 0.25% in Q3 FY26. Additionally, the profit after tax (PAT) margin also fell into negative territory at -10.96%, compared to a positive margin of 0.50% in the prio...
Read full news article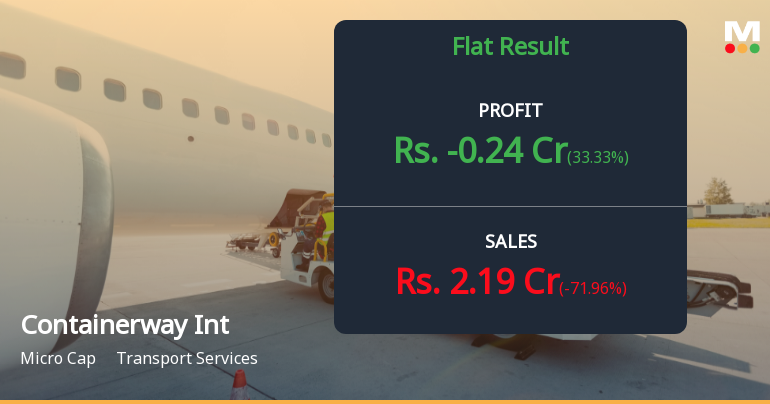
Containerway International Q4 FY26: Losses Deepen as Revenue Collapses 72%
Containerway International Ltd. reported a net loss of ₹0.24 crores for Q4 FY26, marking a sharp deterioration from the ₹0.02 crores profit posted in Q3 FY26. The micro-cap transport services company, with a market capitalisation of just ₹19.00 crores, saw its stock decline 4.57% to ₹16.07 following the results announcement, extending a brutal 65.55% decline over the past year.
Read full news article Announcements
Results-Financial Results For 31St March 2026.
26-May-2026 | Source : BSEAudited Financial Results (standalone) for the Quarter ended 31st March 2026.
Board Meeting Outcome for Outcome Of The Board Meeting Held On Wednesday 28Th May 2025 And Submission Of Audited Financial Results (Standalone) For The Fourth Quarter And Year Ended On 31St March 2026
26-May-2026 | Source : BSEPursuant to Regulations 30 33 and other applicable regulations of SEBI (Listing Obligations and Disclosure Requirements) Regulations 2015 we hereby inform that the Board of Directors of Indus Aluminum Recyclers Limited (formerly known as Containerway International Limited [the Company] at its meeting held today i.e. Tuesday 26th May 2026 has inter-alia discussed approved and taken on record the following matter: 1. Approved Audited Financial Results (Standalone) for the Fourth Quarter and year ended on 31st March 2026.; and 2. Taking on record Audit Report as issued by M/s. Rajeshkumar P. Shah & Co. Statutory Auditors of the Company. We would like to state that M/s. Rajeshkumar P. Shah & Co. statutory auditors of the Company have issued audit reports with unmodified opinion on the Statement.
Clarification On Price Movement
21-May-2026 | Source : BSEClarification on Price Movement sought on 20/05/2026.
Corporate Actions

No Upcoming Board Meetings

No Dividend history available

Containerway International Ltd has announced 5:10 stock split, ex-date: 03 Mar 22

No Bonus history available

No Rights history available
Quality key factors
Valuation key factors
Technicals key factors
 Technical Indicator Scale: Bearish, Mildly Bearish, Sideways, Mildly Bullish, Bullish Turned
 Shareholding Snapshot : Mar 2026
Shareholding Compare (%holding)
Non Institution
None
Held by 1 Schemes (1.73%)
Held by 0 FIIs
Sanket Sanjay Deora (33.16%)
Jignesh Madhukant Mehta (3.5%)
54.72%
Quarterly Results Snapshot (Standalone) - Mar'26 - YoY

YoY Growth in quarter ended Mar 2026 is -71.96% vs 0.00% in Mar 2025

YoY Growth in quarter ended Mar 2026 is 33.33% vs -620.00% in Mar 2025
Half Yearly Results Snapshot (Standalone) - Sep'25
Growth in half year ended Sep 2025 is 618.18% vs 0.00% in Sep 2024
Growth in half year ended Sep 2025 is -312.77% vs 1,275.00% in Sep 2024
Nine Monthly Results Snapshot (Standalone) - Dec'25
YoY Growth in nine months ended Dec 2025 is 43.35% vs 0.00% in Dec 2024
YoY Growth in nine months ended Dec 2025 is -335.71% vs 863.64% in Dec 2024
Annual Results Snapshot (Standalone) - Mar'26
YoY Growth in year ended Mar 2026 is -1.65% vs 0.00% in Mar 2025
YoY Growth in year ended Mar 2026 is -562.50% vs 400.00% in Mar 2025
About Containerway International Ltd

Company Coordinates


