
Compare Cool Caps with Similar Stocks
Dashboard
Weak Long Term Fundamental Strength as the company has not declared results in the last 6 months
- Low ability to service debt as the company has a high Debt to EBITDA ratio of 23.61 times
- The company has been able to generate a Return on Capital Employed (avg) of 5.53% signifying low profitability per unit of total capital (equity and debt)
Flat results in Jun 23
Risky - Negative Operating Profits
Below par performance in long term as well as near term
Stock DNA
Diversified consumer products
INR 247 Cr (Micro Cap)
42.00
35
0.00%
1.68
10.70%
3.16
Total Returns (Price + Dividend) 
Cool Caps for the last several years.
Risk Adjusted Returns v/s
Returns Beta

News

Cool Caps Industries Ltd Locks at Upper Circuit With 5.0% Gain — Buyers Queue, Sellers Absent
At Rs 22.05, the buying was done — not because demand dried up, but because the exchange wouldn't let the stock go any higher. Cool Caps Industries Ltd locked at its upper circuit of 5.0% on 17 Jul 2026, with buyers queuing and no sellers willing to part with shares.
Read full news article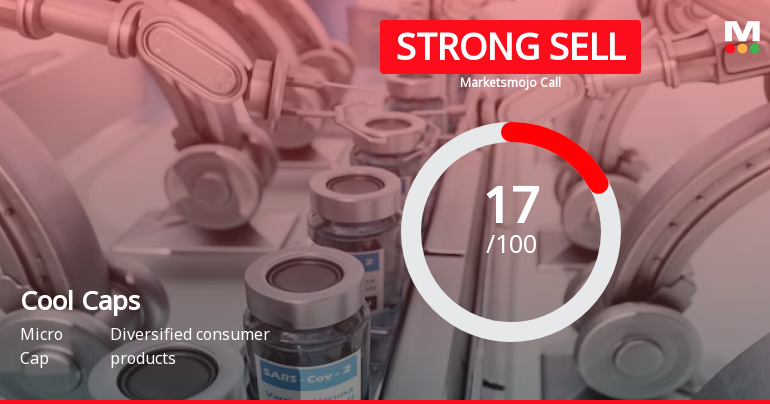
Cool Caps Industries Ltd is Rated Strong Sell
Cool Caps Industries Ltd is rated Strong Sell by MarketsMOJO. This rating was last updated on 08 Dec 2025. However, the analysis and financial metrics discussed here reflect the stock’s current position as of 14 July 2026, providing investors with the latest insights into the company’s performance and outlook.
Read full news article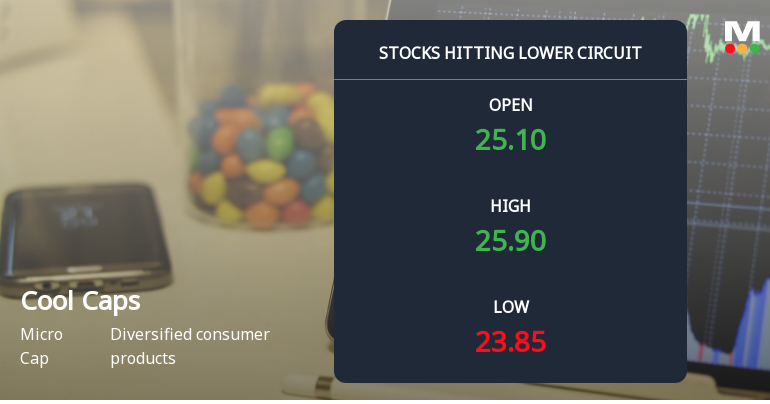
Below All Moving Averages and Now at Lower Circuit: Cool Caps Industries Ltd Loses 4.58% in a Single Session
At Rs 23.85, sellers were still queuing — but there were no buyers willing to take the other side. Cool Caps Industries Ltd locked at its lower circuit of 5% on 7 Jul 2026, with unfilled sell orders and a frozen price, reflecting persistent selling pressure despite the price floor.
Read full news article Announcements
Corporate Actions

No Upcoming Board Meetings

No Dividend history available

Cool Caps Industries Ltd has announced 2:10 stock split, ex-date: 04 Jul 25

Cool Caps Industries Ltd has announced 1:1 bonus issue, ex-date: 04 Jul 25

Cool Caps Industries Ltd has announced 1:1 rights issue, ex-date: 23 Sep 25
Quality key factors
Valuation key factors
Technicals key factors
 Technical Indicator Scale: Bearish, Mildly Bearish, Sideways, Mildly Bullish, Bullish Turned
 Shareholding Snapshot : Mar 2026
Shareholding Compare (%holding)
Promoters
10.4461
Held by 0 Schemes
Held by 0 FIIs
Purv Flexipack Ltd (63.26%)
Holani Consultants Private Limited (1.69%)
25.81%
Quarterly Results Snapshot (Consolidated) - Jun'23 - QoQ

QoQ Growth in quarter ended Jun 2023 is -39.33% vs 0.22% in Mar 2023
QoQ Growth in quarter ended Jun 2023 is -14.00% vs 576.19% in Mar 2023
Half Yearly Results Snapshot (Consolidated) - Sep'25

Growth in half year ended Sep 2025 is 87.83% vs 47.91% in Mar 2025
Growth in half year ended Sep 2025 is -24.85% vs 35.17% in Mar 2025
Nine Monthly Results Snapshot (Consolidated) - Jun'23
YoY Growth in nine months ended Jun 2023 is 129.53% vs 12.50% in Jun 2023
YoY Growth in nine months ended Jun 2023 is 1.17% vs 23.59% in Jun 2023
Annual Results Snapshot (Consolidated) - Mar'25
YoY Growth in year ended Mar 2025 is 55.53% vs -15.58% in Mar 2024
YoY Growth in year ended Mar 2025 is 204.58% vs -31.17% in Mar 2024
About Cool Caps Industries Ltd

Company Coordinates


