
Compare Coral Labs. with Similar Stocks
Dashboard
Poor Management Efficiency with a low ROE of 7.68%
- The company has been able to generate a Return on Equity (avg) of 7.68% signifying low profitability per unit of shareholders funds
The company is Net-Debt Free
Poor long term growth as Net Sales has grown by an annual rate of -2.32% and Operating profit at -1.18% over the last 5 years
Flat results in Mar 26
With ROE of 7.7, it has a Attractive valuation with a 1 Price to Book Value
Majority shareholders : Promoters
Stock DNA
Pharmaceuticals & Biotechnology
INR 207 Cr (Micro Cap)
13.00
37
0.26%
-0.47
7.72%
0.99
Total Returns (Price + Dividend) 
Latest dividend: 1.48775974950185 per share ex-dividend date: Sep-19-2025
Risk Adjusted Returns v/s
Returns Beta

News
Coral Laboratories Ltd is Rated Hold
Coral Laboratories Ltd is rated 'Hold' by MarketsMOJO, with this rating last updated on 24 June 2026. However, the analysis and financial metrics discussed here reflect the stock's current position as of 28 July 2026, providing investors with an up-to-date view of the company’s fundamentals, valuation, financial trends, and technical outlook.
Read full news article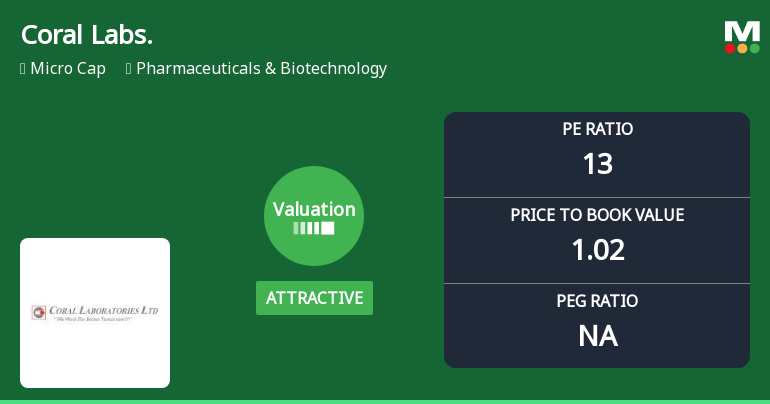
Coral Laboratories Ltd Valuation Shifts Signal Renewed Price Attractiveness
Coral Laboratories Ltd has seen a notable shift in its valuation parameters, moving from a fair to an attractive rating as of late June 2026. This change comes despite a modest day decline of 1.16% and amid a challenging pharmaceutical sector landscape, highlighting a potential opportunity for investors seeking value in the micro-cap space.
Read full news article
Coral Laboratories Ltd is Rated Hold
Coral Laboratories Ltd is rated 'Hold' by MarketsMOJO, with this rating last updated on 24 June 2026. However, the analysis and financial metrics discussed here reflect the stock's current position as of 17 July 2026, providing investors with an up-to-date view of the company’s fundamentals, returns, and market standing.
Read full news article Announcements
Shareholder Meeting / Postal Ballot-Scrutinizers Report
23-Jul-2026 | Source : BSEPostal ballot e-voting results alongwith Scrutinizers Report
Shareholder Meeting / Postal Ballot-Outcome of Postal_Ballot
23-Jul-2026 | Source : BSEOutcome of Postal ballot result alongwith Scrutinizer Report
Compliances-Certificate under Reg. 74 (5) of SEBI (DP) Regulations 2018
14-Jul-2026 | Source : BSECertificate under Regulation 74(5) of the SEBI (DP) Regulations 2018
Corporate Actions

No Upcoming Board Meetings

Coral Laboratories Ltd has declared 15% dividend, ex-date: 19 Sep 25

No Splits history available

No Bonus history available

No Rights history available
Quality key factors
Valuation key factors
Technicals key factors
 Technical Indicator Scale: Bearish, Mildly Bearish, Sideways, Mildly Bullish, Bullish Turned
 Shareholding Snapshot : Jun 2026
Shareholding Compare (%holding)
Promoters
None
Held by 0 Schemes
Held by 0 FIIs
Chetan Navinchandra Doshi (51.54%)
Meeta Samir Sheth (1.84%)
19.93%
Quarterly Results Snapshot (Standalone) - Mar'26 - YoY

YoY Growth in quarter ended Mar 2026 is -5.87% vs -2.63% in Mar 2025

YoY Growth in quarter ended Mar 2026 is 84.45% vs -51.12% in Mar 2025
Half Yearly Results Snapshot (Standalone) - Sep'25
Growth in half year ended Sep 2025 is -40.73% vs 74.06% in Sep 2024
Growth in half year ended Sep 2025 is -44.80% vs 93.38% in Sep 2024
Nine Monthly Results Snapshot (Standalone) - Dec'25
YoY Growth in nine months ended Dec 2025 is -31.60% vs 58.58% in Dec 2024
YoY Growth in nine months ended Dec 2025 is -47.65% vs 112.99% in Dec 2024
Annual Results Snapshot (Standalone) - Mar'26
YoY Growth in year ended Mar 2026 is -25.31% vs 37.47% in Mar 2025
YoY Growth in year ended Mar 2026 is -32.20% vs 53.01% in Mar 2025
About Coral Laboratories Ltd

Company Coordinates


