
Compare Coral Labs. with Similar Stocks
Dashboard
Poor Management Efficiency with a low ROE of 7.68%
- The company has been able to generate a Return on Equity (avg) of 7.68% signifying low profitability per unit of shareholders funds
Poor long term growth as Net Sales has grown by an annual rate of -2.32% and Operating profit at -1.18% over the last 5 years
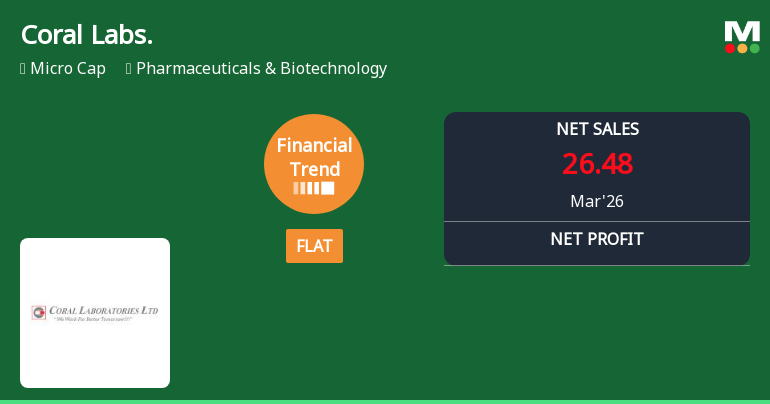
Flat results in Mar 26
Underperformed the market in the last 1 year
Stock DNA
Pharmaceuticals & Biotechnology
INR 175 Cr (Micro Cap)
11.00
33
0.30%
-0.47
7.72%
0.86
Total Returns (Price + Dividend) 
Latest dividend: 1.5 per share ex-dividend date: Sep-19-2025
Risk Adjusted Returns v/s
Returns Beta

News
Coral Laboratories Ltd Reports Flat Quarterly Financial Trend Amid Mixed Performance
Coral Laboratories Ltd, a micro-cap player in the Pharmaceuticals & Biotechnology sector, has reported a flat financial performance for the quarter ended March 2026, signalling a pause in its previously positive growth trajectory. While key profitability metrics have improved notably, revenue growth has contracted, and return on capital employed has hit a new low, raising questions about the sustainability of recent gains.
Read full news articleAre Coral Laboratories Ltd latest results good or bad?
Coral Laboratories Ltd's latest financial results for Q4 FY26 present a mixed picture, highlighting both operational challenges and improvements in profitability metrics. The company reported a net profit of ₹5.22 crores, reflecting a significant year-on-year growth of 84.45%, contrasting with a decline in net sales, which decreased by 5.87% to ₹26.48 crores compared to the same quarter last year. This decline raises concerns about sustainable demand in a competitive pharmaceutical landscape. Despite the revenue challenges, Coral Laboratories achieved a notable operating profit margin of 23.41%, which is a substantial improvement from 9.53% in the previous year, indicating effective cost management and operational efficiency. This margin expansion, alongside the increase in net profit, suggests that the company is capable of converting sales into profits more effectively, even amidst declining revenue. On...
Read full news article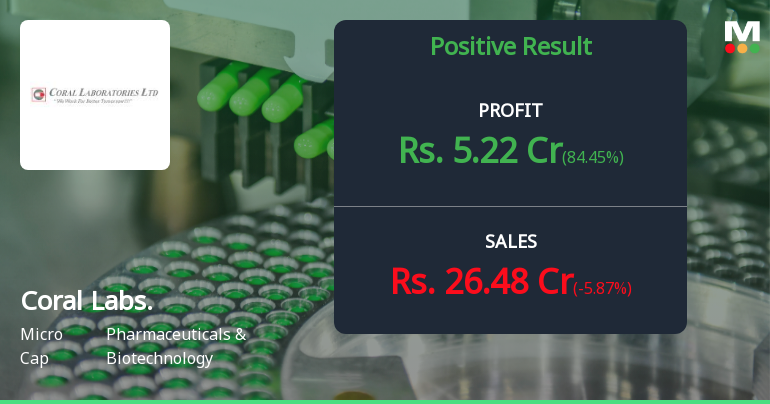
Coral Laboratories Q4 FY26: Profit Surge Masks Revenue Decline Concerns
Coral Laboratories Limited, a Vadodara-based pharmaceutical formulations manufacturer with a market capitalisation of ₹174.00 crores, reported a mixed performance for Q4 FY26 ended March 2026. The company posted a net profit of ₹5.22 crores, representing a robust sequential growth of 87.77% from Q3 FY26's ₹2.78 crores, though the year-on-year comparison showed an 84.45% surge from Q4 FY25's ₹2.83 crores. However, this profit expansion came against a backdrop of declining revenues, with net sales falling 5.87% year-on-year to ₹26.48 crores from ₹28.13 crores in the corresponding quarter last year.
Read full news article Announcements
Corporate Action-Board approves Dividend
30-May-2026 | Source : BSEFinal dividend of ? 2 per share
Compliances-Reg.24(A)-Annual Secretarial Compliance
30-May-2026 | Source : BSEAnnua Secretarial Compliance Report for the financial year ended March 31 2026
Announcement under Regulation 30 (LODR)-Dividend Updates
30-May-2026 | Source : BSEThe Board has approved ? 2 per share dividend.
Corporate Actions

No Upcoming Board Meetings

Coral Laboratories Ltd has declared 15% dividend, ex-date: 19 Sep 25

No Splits history available

No Bonus history available

No Rights history available
Quality key factors
Valuation key factors
Technicals key factors
 Technical Indicator Scale: Bearish, Mildly Bearish, Sideways, Mildly Bullish, Bullish Turned
 Shareholding Snapshot : Mar 2026
Shareholding Compare (%holding)
Promoters
None
Held by 0 Schemes
Held by 0 FIIs
Chetan Navinchandra Doshi (51.54%)
Meeta Samir Sheth (1.84%)
19.93%
Quarterly Results Snapshot (Standalone) - Mar'26 - YoY

YoY Growth in quarter ended Mar 2026 is -5.87% vs -2.63% in Mar 2025

YoY Growth in quarter ended Mar 2026 is 84.45% vs -51.12% in Mar 2025
Half Yearly Results Snapshot (Standalone) - Sep'25
Growth in half year ended Sep 2025 is -40.73% vs 74.06% in Sep 2024
Growth in half year ended Sep 2025 is -44.80% vs 93.38% in Sep 2024
Nine Monthly Results Snapshot (Standalone) - Dec'25
YoY Growth in nine months ended Dec 2025 is -31.60% vs 58.58% in Dec 2024
YoY Growth in nine months ended Dec 2025 is -47.65% vs 112.99% in Dec 2024
Annual Results Snapshot (Standalone) - Mar'26
YoY Growth in year ended Mar 2026 is -25.31% vs 37.47% in Mar 2025
YoY Growth in year ended Mar 2026 is -32.20% vs 53.01% in Mar 2025
About Coral Laboratories Ltd

Company Coordinates


