
 Price Point
Compare Coromandel Engg. with Similar Stocks
ScoreDashboard
High Debt company with Weak Long Term Fundamental Strength
- Poor long term growth as Net Sales has grown by an annual rate of -17.06% over the last 5 years
- High Debt Company with a Debt to Equity ratio (avg) of 2.89 times
- The company has been able to generate a Return on Equity (avg) of 6.18% signifying low profitability per unit of shareholders funds
With ROCE of 10.8, it has a Expensive valuation with a 6.4 Enterprise value to Capital Employed
Underperformed the market in the last 1 year


 Total Returns
Total Returns (Price + Dividend) 
Latest dividend: 0.3827862737784408 per share ex-dividend date: Jul-07-2011
Risk Adjusted Returns v/s
Returns Beta
 News & Corporate Actions
News
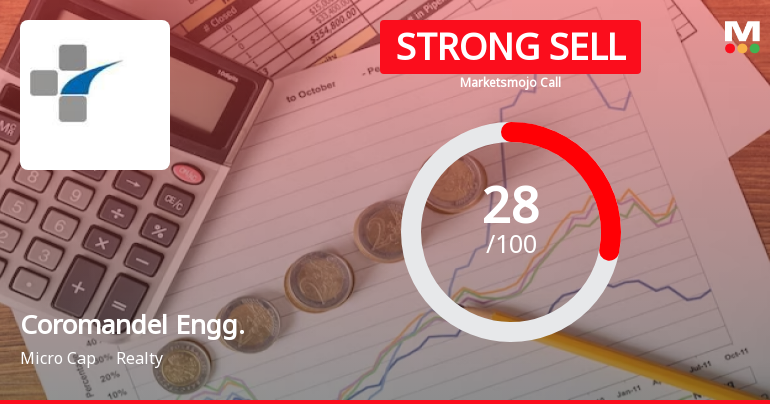
Coromandel Engineering Company Ltd is Rated Strong Sell
Coromandel Engineering Company Ltd is rated Strong Sell by MarketsMOJO. This rating was last updated on 02 June 2026. However, the analysis and financial metrics discussed here reflect the stock's current position as of 31 August 2026, providing investors with the latest insights into the company’s performance and outlook.
Read full news article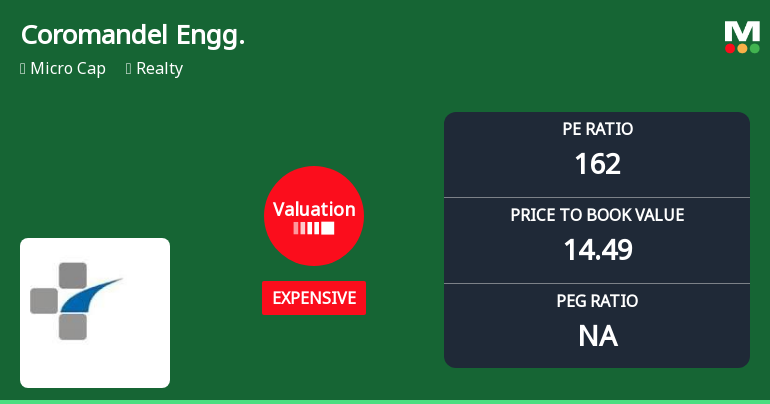
Coromandel Engineering Company Ltd: Valuation Shifts Signal Price Attractiveness Decline
Coromandel Engineering Company Ltd, a micro-cap player in the Realty sector, has seen its valuation parameters shift notably, raising questions about its price attractiveness amid a challenging market backdrop. Recent data reveals a move from a very expensive to an expensive valuation grade, with key metrics such as the price-to-earnings (P/E) and price-to-book value (P/BV) ratios significantly outpacing sector peers and historical averages.
Read full news article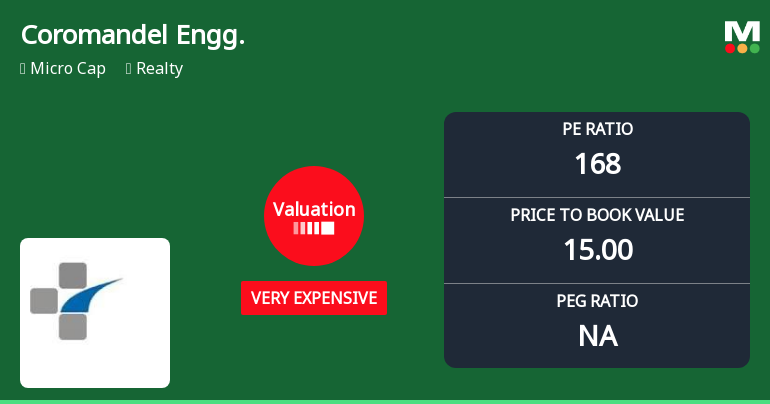
Coromandel Engineering Company Ltd: Valuation Shifts Signal Heightened Price Risk
Coromandel Engineering Company Ltd, a micro-cap player in the Realty sector, has seen its valuation metrics surge to levels that now classify it as very expensive. With a price-to-earnings (P/E) ratio soaring to 167.55 and a price-to-book value (P/BV) of 15.00, investors face a stark shift in price attractiveness compared to historical and peer benchmarks. This article analyses the implications of these valuation changes amid the company’s recent market performance and sector context.
Read full news article Announcements
Announcement under Regulation 30 (LODR)-Newspaper Publication
14-Aug-2026 | Source : BSEUnaudited financials of Quarter ended 30.06.2026
Statement Of Deviation & Variation For Quarter Ended 30.06.2026
12-Aug-2026 | Source : BSEStatement of Deviation & Variation for quarter ended 30.06.2026
Board Meeting Outcome for Unaudited Standalone Financials Of Quarter Ended 30.06.2026
12-Aug-2026 | Source : BSEIntimation of Unaudited Standalone financials of Quarter ended 30.06.2026
Corporate Actions

No Upcoming Board Meetings

Coromandel Engineering Company Ltd has declared 25% dividend, ex-date: 07 Jul 11

No Splits history available

No Bonus history available

Coromandel Engineering Company Ltd has announced 91:10 rights issue, ex-date: 13 Jan 14
Key FactorsQuality key factors
Valuation key factors
Technicals key factors
 Technical Indicator Scale: Bearish, Mildly Bearish, Sideways, Mildly Bullish, Bullish Turned Shareholding
Shareholding Snapshot : Jun 2026
Shareholding Compare (%holding)
Promoters
None
Held by 0 Schemes
Held by 0 FIIs
Sundeep Anand Jegath Rakshagan (25.11%)
Chetan Jayantilal Shah (2.04%)
24.55%
FinancialQuarterly Results Snapshot (Standalone) - Jun'26 - QoQ
 Compare with Peers
QoQ Growth in quarter ended Jun 2026 is 3.16% vs 141.72% in Mar 2026
QoQ Growth in quarter ended Jun 2026 is -59.76% vs 1,950.00% in Mar 2026

Half Yearly Results Snapshot (Standalone) - Sep'24
Growth in half year ended Sep 2024 is -65.60% vs -29.56% in Sep 2023

Growth in half year ended Sep 2024 is 3.79% vs -26.29% in Sep 2023
Nine Monthly Results Snapshot (Standalone) - Dec'24
YoY Growth in nine months ended Dec 2024 is -66.63% vs -27.72% in Dec 2023
YoY Growth in nine months ended Dec 2024 is 43.87% vs -5.21% in Dec 2023
Annual Results Snapshot (Standalone) - Mar'26
YoY Growth in year ended Mar 2026 is 37.71% vs -67.62% in Mar 2025
YoY Growth in year ended Mar 2026 is -58.54% vs 109.32% in Mar 2025
 Company CV
About Coromandel Engineering Company Ltd

Company Coordinates










