
Compare Coromandel Engg. with Similar Stocks
Dashboard
High Debt company with Weak Long Term Fundamental Strength
- Poor long term growth as Net Sales has grown by an annual rate of -16.87% over the last 5 years
- High Debt Company with a Debt to Equity ratio (avg) of 3.58 times
- The company has been able to generate a Return on Equity (avg) of 1.55% signifying low profitability per unit of shareholders funds
With ROCE of 9.2, it has a Very Expensive valuation with a 6.3 Enterprise value to Capital Employed
Total Returns (Price + Dividend) 
Latest dividend: 0.3827881387541961 per share ex-dividend date: Jul-07-2011
Risk Adjusted Returns v/s
Returns Beta

News

Coromandel Engineering Company Ltd is Rated Strong Sell
Coromandel Engineering Company Ltd is rated Strong Sell by MarketsMOJO. This rating was last updated on 02 June 2026, reflecting a reassessment of the company’s outlook. However, all fundamentals, returns, and financial metrics discussed here are based on the company’s current position as of 28 July 2026, providing investors with the most up-to-date analysis.
Read full news article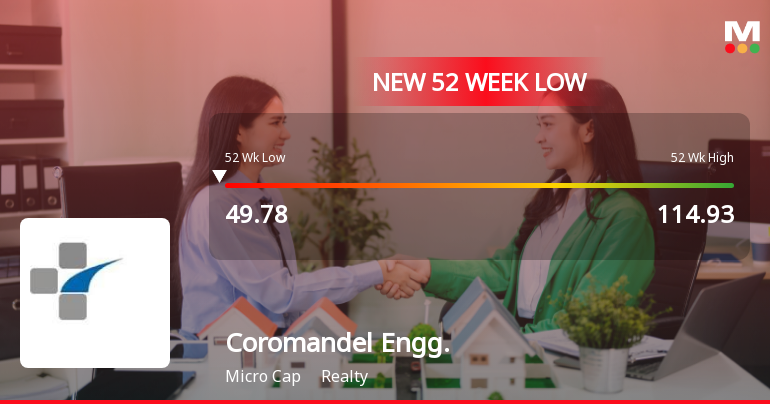
Markets Rally, But Coromandel Engineering Company Ltd Sinks to 52-Week Low in Stock-Specific Sell-Off
While the broader market indices have shown resilience, Coromandel Engineering Company Ltd has succumbed to selling pressure, touching a fresh 52-week low of Rs 49.78 on 24 Jul 2026. The stock’s recent decline highlights a divergence from the overall market trend and raises questions about the underlying factors weighing on this micro-cap realty player.
Read full news article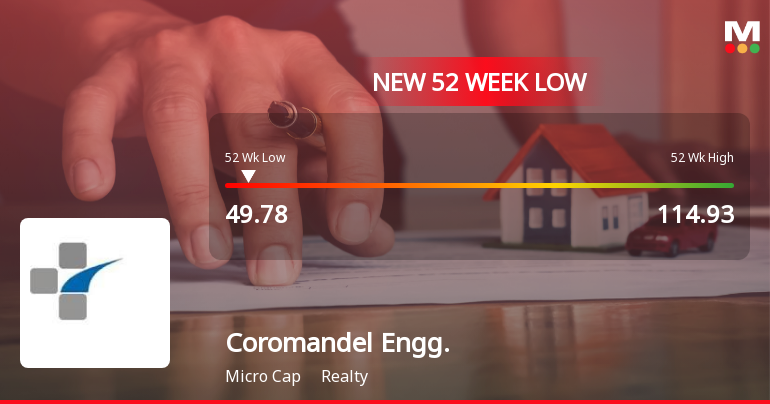
Announcements
Shareholder Meeting / Postal Ballot-Scrutinizers Report
11-Jul-2026 | Source : BSEScrutinizer report dated 11.07.2026
Compliances-Certificate under Reg. 74 (5) of SEBI (DP) Regulations 2018
09-Jul-2026 | Source : BSECertficate under Reg 74(5) of SEBI
Closure of Trading Window
24-Jun-2026 | Source : BSEClosure of trading window for the quarter ending June 2026
Corporate Actions

No Upcoming Board Meetings

Coromandel Engineering Company Ltd has declared 25% dividend, ex-date: 07 Jul 11

No Splits history available

No Bonus history available

Coromandel Engineering Company Ltd has announced 91:10 rights issue, ex-date: 13 Jan 14
Quality key factors
Valuation key factors
Technicals key factors
 Technical Indicator Scale: Bearish, Mildly Bearish, Sideways, Mildly Bullish, Bullish Turned
 Shareholding Snapshot : Jun 2026
Shareholding Compare (%holding)
Promoters
None
Held by 0 Schemes
Held by 0 FIIs
Sundeep Anand Jegath Rakshagan (25.11%)
Chetan Jayantilal Shah (2.04%)
24.55%
Quarterly Results Snapshot (Standalone) - Mar'26 - QoQ

QoQ Growth in quarter ended Mar 2026 is 141.72% vs -54.17% in Dec 2025
QoQ Growth in quarter ended Mar 2026 is 1,950.00% vs 33.33% in Dec 2025
Half Yearly Results Snapshot (Standalone) - Sep'24

Growth in half year ended Sep 2024 is -65.60% vs -29.56% in Sep 2023
Growth in half year ended Sep 2024 is 3.79% vs -26.29% in Sep 2023
Nine Monthly Results Snapshot (Standalone) - Dec'24
YoY Growth in nine months ended Dec 2024 is -66.63% vs -27.72% in Dec 2023
YoY Growth in nine months ended Dec 2024 is 43.87% vs -5.21% in Dec 2023
Annual Results Snapshot (Standalone) - Mar'26
YoY Growth in year ended Mar 2026 is 37.71% vs -67.62% in Mar 2025
YoY Growth in year ended Mar 2026 is -58.54% vs 109.32% in Mar 2025
About Coromandel Engineering Company Ltd

Company Coordinates


