
Compare Coromandel Engg. with Similar Stocks
Dashboard
High Debt company with Weak Long Term Fundamental Strength
- Poor long term growth as Net Sales has grown by an annual rate of -16.87% over the last 5 years
- High Debt Company with a Debt to Equity ratio (avg) of 3.58 times
- The company has been able to generate a Return on Equity (avg) of 1.55% signifying low profitability per unit of shareholders funds
With ROCE of 9.2, it has a Very Expensive valuation with a 6.3 Enterprise value to Capital Employed
Below par performance in long term as well as near term
Total Returns (Price + Dividend) 
Latest dividend: 2.5 per share ex-dividend date: Jul-07-2011
Risk Adjusted Returns v/s
Returns Beta

News
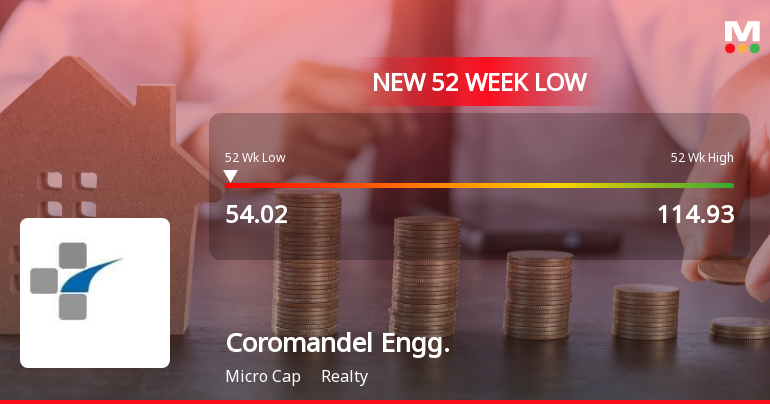

Coromandel Engineering Company Ltd Falls to 52-Week Low of Rs 54.52 as Sell-Off Deepens
For the ninth consecutive session, Coromandel Engineering Company Ltd has seen its share price decline, culminating in a fresh 52-week low of Rs 54.52 on 10 Jun 2026. This extended sell-off has wiped out over 28% of value in just over a week, underscoring persistent selling pressure despite a broader market that is showing signs of resilience.
Read full news article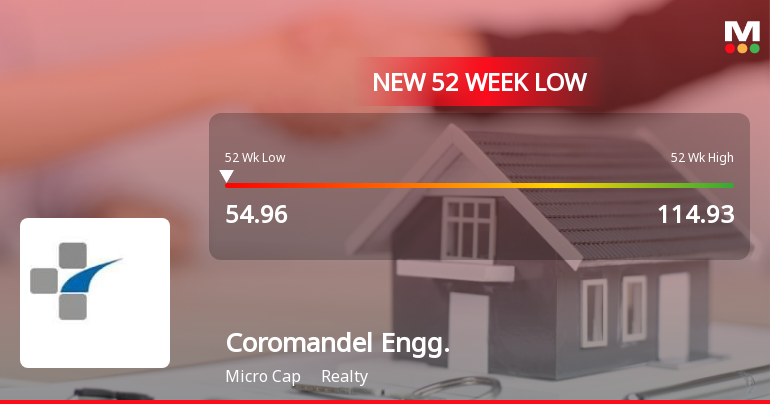
Coromandel Engineering Company Ltd Falls to 52-Week Low of Rs 54.96 as Sell-Off Deepens
For the eighth consecutive session, Coromandel Engineering Company Ltd has closed lower, culminating in a fresh 52-week low of Rs 54.96 on 09 Jun 2026. This marks a 27.78% decline over this losing streak, underscoring sustained selling pressure despite a modest intraday recovery attempt.
Read full news article Announcements
Shareholder Meeting / Postal Ballot-Notice of Postal Ballot
09-Jun-2026 | Source : BSEPostal Ballot Notice Intimation to the Shareholder via email on 9th June 2026
Audited Financial Result For The Year Ended 31St March 2026
25-May-2026 | Source : BSEAudited Financial Result for the year ended 31st March 2026
Board Meeting Outcome for Audited Financial Statement For The Financial Year Ended 31St March 2026 Along With Audit Report
25-May-2026 | Source : BSEAudited Financial Statement for the financial year ended 31st March 2026 along with audit report
Corporate Actions

No Upcoming Board Meetings

Coromandel Engineering Company Ltd has declared 25% dividend, ex-date: 07 Jul 11

No Splits history available

No Bonus history available

Coromandel Engineering Company Ltd has announced 91:10 rights issue, ex-date: 13 Jan 14
Quality key factors
Valuation key factors
Technicals key factors
 Technical Indicator Scale: Bearish, Mildly Bearish, Sideways, Mildly Bullish, Bullish Turned
 Shareholding Snapshot : Mar 2026
Shareholding Compare (%holding)
Promoters
None
Held by 0 Schemes
Held by 0 FIIs
Sundeep Anand Jegath Rakshagan (25.11%)
Chetan Jayantilal Shah (2.04%)
24.47%
Quarterly Results Snapshot (Standalone) - Mar'26 - QoQ

QoQ Growth in quarter ended Mar 2026 is 141.72% vs -54.17% in Dec 2025
QoQ Growth in quarter ended Mar 2026 is 1,950.00% vs 33.33% in Dec 2025
Half Yearly Results Snapshot (Standalone) - Sep'24

Growth in half year ended Sep 2024 is -65.60% vs -29.56% in Sep 2023
Growth in half year ended Sep 2024 is 3.79% vs -26.29% in Sep 2023
Nine Monthly Results Snapshot (Standalone) - Dec'24
YoY Growth in nine months ended Dec 2024 is -66.63% vs -27.72% in Dec 2023
YoY Growth in nine months ended Dec 2024 is 43.87% vs -5.21% in Dec 2023
Annual Results Snapshot (Standalone) - Mar'26
YoY Growth in year ended Mar 2026 is 37.71% vs -67.62% in Mar 2025
YoY Growth in year ended Mar 2026 is -58.54% vs 109.32% in Mar 2025
About Coromandel Engineering Company Ltd

Company Coordinates


