
Compare Corporacion America Airports SA with Similar Stocks
Dashboard
1
Low ability to service debt as the company has a high Debt to EBITDA ratio of 2.73 times
- Poor long term growth as Net Sales has grown by an annual rate of 9.49% and Operating profit at 43.37% over the last 5 years
- Low ability to service debt as the company has a high Debt to EBITDA ratio of 2.73 times
- The company has been able to generate a Return on Equity (avg) of 12.34% signifying low profitability per unit of shareholders funds
2
Poor long term growth as Net Sales has grown by an annual rate of 9.49% and Operating profit at 43.37% over the last 5 years
3
The company declared negative results in Mar'25 after positive results in Dec'24
4
With ROCE of 18.08%, it has a very expensive valuation with a 1.95 Enterprise value to Capital Employed
Total Returns (Price + Dividend) 
TimePeriod
Price Return
Dividend Return
Total Return
3 Months
65.14%
0%
65.14%
6 Months
45.81%
0%
45.81%
1 Year
65.71%
0%
65.71%
2 Years
164.65%
0%
164.65%
3 Years
373.0%
0%
373.0%
4 Years
438.18%
0%
438.18%
5 Years
823.32%
0%
823.32%
Corporacion America Airports SA for the last several years.
Risk Adjusted Returns v/s
News
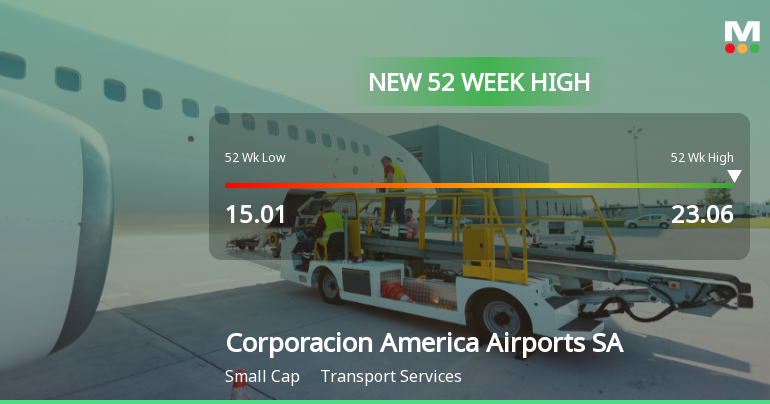
Corporacion America Airports SA Hits New 52-Week High at USD 23.06
Corporacion America Airports SA achieved a new 52-week high of USD 23.06 on November 11, 2025, reflecting strong performance in the transport services sector. With a market capitalization of USD 3,142 million, the company demonstrates effective management and a conservative leverage approach, despite having no dividend yield.
Read full news article Announcements

No announcement available
Corporate Actions
No corporate action available
Quality key factors
Factor
Value
Sales Growth (5y)
9.49%
EBIT Growth (5y)
43.37%
EBIT to Interest (avg)
1.14
Debt to EBITDA (avg)
2.73
Net Debt to Equity (avg)
0.43
Sales to Capital Employed (avg)
0.71
Tax Ratio
58.38%
Dividend Payout Ratio
0
Pledged Shares
0
Institutional Holding
16.51%
ROCE (avg)
12.60%
ROE (avg)
12.34%
Valuation key factors
Factor
Value
P/E Ratio
22
Industry P/E
Price to Book Value
2.36
EV to EBIT
10.79
EV to EBITDA
6.77
EV to Capital Employed
1.95
EV to Sales
2.23
PEG Ratio
NA
Dividend Yield
NA
ROCE (Latest)
18.08%
ROE (Latest)
10.64%
Technicals key factors
Indicator
Weekly
Monthly
MACD
Bullish
Bullish
RSI
No Signal
No Signal
Bollinger Bands
Mildly Bullish
Mildly Bullish
Moving Averages
Bullish (Daily)
KST
Bullish
Bullish
Dow Theory
Bullish
No Trend
OBV
No Trend
No Trend
 Technical Indicator Scale: Bearish, Mildly Bearish, Sideways, Mildly Bullish, Bullish Turned
 Shareholding Snapshot : Sep 2025
Shareholding Compare (%holding)
Majority shareholders
Foreign Institutions
Domestic Funds
Held in 12 Schemes (1.38%)
Foreign Institutions
Held by 45 Foreign Institutions (11.21%)
Strategic Entities with highest holding
Highest Public shareholder
Quarterly Results Snapshot (Consolidated) - Sep'25 - YoY
Sep'25
Sep'24
Change(%)
Net Sales
527.30
461.80
14.18%
Operating Profit (PBDIT) excl Other Income
191.50
140.80
36.01%
Interest
25.70
26.40
-2.65%
Exceptional Items
-0.20
-18.70
98.93%
Consolidate Net Profit
58.70
0.70
8,285.71%
Operating Profit Margin (Excl OI)
266.90%
205.40%
6.15%
USD in Million.

Net Sales
YoY Growth in quarter ended Sep 2025 is 14.18% vs -1.64% in Sep 2024
Consolidated Net Profit
YoY Growth in quarter ended Sep 2025 is 8,285.71% vs -98.67% in Sep 2024
Annual Results Snapshot (Consolidated) - Dec'24
Dec'24
Dec'23
Change(%)
Net Sales
1,843.30
1,400.00
31.66%
Operating Profit (PBDIT) excl Other Income
613.60
497.40
23.36%
Interest
107.20
99.30
7.96%
Exceptional Items
-71.20
25.90
-374.90%
Consolidate Net Profit
307.90
226.50
35.94%
Operating Profit Margin (Excl OI)
221.30%
247.60%
-2.63%
USD in Million.
Net Sales
YoY Growth in year ended Dec 2024 is 31.66% vs 1.54% in Dec 2023

Consolidated Net Profit
YoY Growth in year ended Dec 2024 is 35.94% vs 36.78% in Dec 2023
About Corporacion America Airports SA

Corporacion America Airports SA
Transport Services
Corporacion America Airports SA is a focused on acquiring, developing and operating airport concessions. It operates approximately 52 airports globally in Latin America, Europe and Eurasia. The Company’s airports are located in Argentina, Italy, Brazil, Uruguay, Ecuador, Armenia, and Peru. The Company’s Argentine provinces serves metropolitan areas in several Argentine provinces, such as Buenos Aires, Cordoba and Mendoza and the city of Buenos Aires, tourist destinations, such as Bariloche, Mar del Plata and Iguazu, regional centers, such as Cordoba, Santa Rosa, San Luis, San Juan, La Rioja, Santiago del Estero and Catamarca and border province cities, such as Mendoza, Iguazu, Salta and Bariloche.
Company Coordinates
Company Details
4, rue de la Greve , LUXEMBOURG None : 1643


Registrar Details
InfinHub Market Technologies FZ-LLC, Building-2, Unit 112, Dubai Internet City, Dubai, United Arab Emirates
GET THE MARKETSMOJO APP


Company
Stocks
Portfolio


"Investment in securities markets are subject to market risk. Read all the related documents carefully before investing."