
Compare Covance Softsol with Similar Stocks
Dashboard
The company is Net-Debt Free
Healthy long term growth as Net Sales has grown by an annual rate of 54.50% and Operating profit at 546.37%
The company has declared Positive results for the last 4 consecutive quarters
With ROE of 20.4, it has a Very Attractive valuation with a 3.1 Price to Book Value
Market Beating Performance
Stock DNA
Computers - Software & Consulting
INR 551 Cr (Micro Cap)
15.00
21
0.00%
-1.27
20.38%
3.25
Total Returns (Price + Dividend) 
Covance Softsol for the last several years.
Risk Adjusted Returns v/s
Returns Beta

News

Covance Softsol Ltd is Rated Buy
Covance Softsol Ltd is rated 'Buy' by MarketsMOJO, with this rating last updated on 20 July 2026. While the rating change occurred on that date, the analysis and financial metrics presented here reflect the stock's current position as of 31 July 2026, providing investors with the latest insights into the company’s performance and outlook.
Read full news article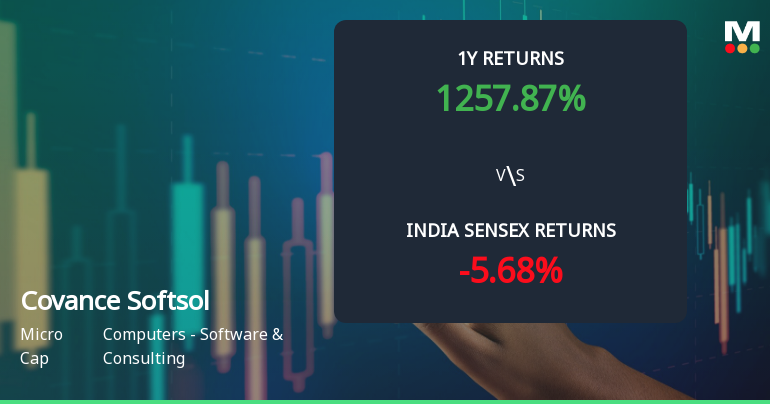
Covance Softsol Ltd Sees Technical Momentum Shift Amid Mixed Indicator Signals
Covance Softsol Ltd, a micro-cap player in the Computers - Software & Consulting sector, has experienced a notable shift in its technical momentum, moving from a bullish to a mildly bullish trend. Despite a slight dip in the share price to ₹259.50 from the previous close of ₹263.30, the stock continues to demonstrate strong relative performance against the broader market, supported by a Mojo Score of 74.0 and a Buy rating, albeit downgraded from Strong Buy on 20 July 2026.
Read full news article
From Gap-Down to Record Close: Covance Softsol Ltd Touches All-Time High at Rs 270
After opening with a sharp intraday loss of 4.96%, Covance Softsol Ltd staged a robust recovery to close at a fresh all-time high of Rs 270 on 27 Jul 2026, extending its winning streak to five consecutive sessions and marking a 17.72% gain over this period.
Read full news article Announcements
Compliances-Certificate under Reg. 74 (5) of SEBI (DP) Regulations 2018
09-Jul-2026 | Source : BSECertificate under Reg 74(5) of SEBI (DP) Regulations 2018 for the quarter ended June 30 2026
Closure of Trading Window
27-Jun-2026 | Source : BSEIntimation of Closure of Trading Window for the 1st Quarter ended 30.06.2026
Announcement under Regulation 30 (LODR)-Newspaper Publication
01-Jun-2026 | Source : BSESubmission of Newspaper Publication of Audited Standalone and Consolidated Financial Results for the 4th Quarter and year ended March 31 2026.
Corporate Actions

No Upcoming Board Meetings

No Dividend history available

No Splits history available

No Bonus history available

Covance Softsol Ltd has announced 1:2 rights issue, ex-date: 29 Aug 25
Quality key factors
Valuation key factors
Technicals key factors
 Technical Indicator Scale: Bearish, Mildly Bearish, Sideways, Mildly Bullish, Bullish Turned
 Shareholding Snapshot : Jun 2026
Shareholding Compare (%holding)
Promoters
None
Held by 0 Schemes
Held by 0 FIIs
Durga V L K Madala (64.74%)
Talluri Samatha (22.52%)
4.62%
Quarterly Results Snapshot (Consolidated) - Mar'26 - QoQ

QoQ Growth in quarter ended Mar 2026 is 15.91% vs 11.03% in Dec 2025

QoQ Growth in quarter ended Mar 2026 is -50.04% vs 64.19% in Dec 2025
Half Yearly Results Snapshot (Standalone) - Sep'25
Not Applicable: The company has declared_date for only one period
Not Applicable: The company has declared_date for only one period
Nine Monthly Results Snapshot (Standalone) - Dec'25
Not Applicable: The company has declared_date for only one period
Not Applicable: The company has declared_date for only one period
Annual Results Snapshot (Consolidated) - Mar'26
YoY Growth in year ended Mar 2026 is 43.52% vs 66.26% in Mar 2025
YoY Growth in year ended Mar 2026 is 183.66% vs 869.60% in Mar 2025
About Covance Softsol Ltd

Company Coordinates


