
Compare CP Capital with Similar Stocks
Stock DNA
Other Consumer Services
INR 208 Cr (Micro Cap)
5.00
NA
0.00%
0.13
7.43%
0.35
Total Returns (Price + Dividend) 
Latest dividend: 1 per share ex-dividend date: Feb-21-2025
Risk Adjusted Returns v/s
Returns Beta

News

CP Capital Limited is Rated Sell
CP Capital Limited is rated Sell by MarketsMOJO, with this rating last updated on 07 Apr 2025. However, the analysis and financial metrics discussed here reflect the company’s current position as of 23 June 2026, providing investors with an up-to-date view of the stock’s fundamentals, returns, and technical outlook.
Read full news article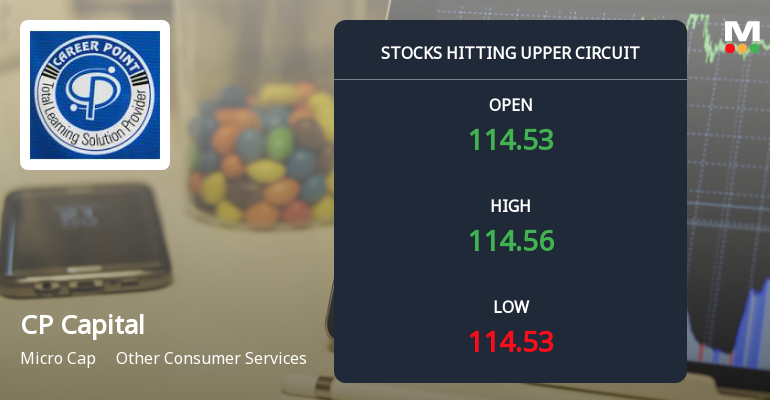
CP Capital Limited Locks at Upper Circuit With 4.99% Gain — Buyers Queue, Sellers Absent
At Rs 115.26, the buying was done — not because demand dried up, but because the exchange wouldn't let the stock go any higher. CP Capital Limited locked at its upper circuit of 4.99% on 23 Jun 2026, with buyers queuing and no sellers willing to part with shares.
Read full news article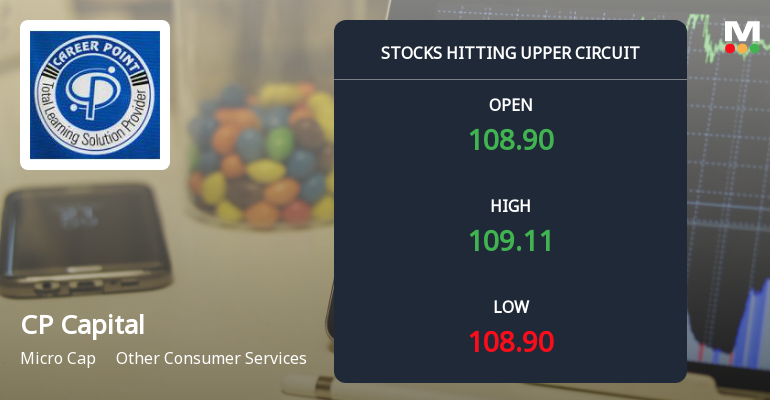
CP Capital Limited Locks at Upper Circuit With 5% Gain — Buyers Queue, Sellers Absent
At Rs 109.78, the buying was done — not because demand dried up, but because the exchange wouldn't let the stock go any higher. CP Capital Limited locked at its upper circuit of 4.99% on 22 Jun 2026, with buyers queuing and no sellers willing to part with shares.
Read full news article Announcements
Announcement under Regulation 30 (LODR)-Newspaper Publication
31-May-2026 | Source : BSENewspaper Publication pertaining to the quarter and year ended 31st March 2026
Board Meeting Outcome for Outcome Of Board Meeting Held On Friday May 29 2026 And Disclosures Under Regulation 30 Of The Securities And Exchange Board Of India (Listing Obligations And Disclosure Requirements) Regulations 2015 (Listing Regulations)
29-May-2026 | Source : BSEPlease find enclosed herewith Audited Financial Results (Standalone & Consolidated) for the quarter and financial year ended on March 31 2026
Announcement under Regulation 30 (LODR)-Investor Presentation
29-May-2026 | Source : BSEInvestor update
Corporate Actions

No Upcoming Board Meetings

CP Capital Limited has declared 10% dividend, ex-date: 21 Feb 25

No Splits history available

No Bonus history available

No Rights history available
Quality key factors
Valuation key factors
Technicals key factors
 Technical Indicator Scale: Bearish, Mildly Bearish, Sideways, Mildly Bullish, Bullish Turned
 Shareholding Snapshot : Mar 2026
Shareholding Compare (%holding)
Promoters
None
Held by 0 Schemes
Held by 1 FIIs (0.05%)
Kailash Bai (14.73%)
Manish Jain (3.16%)
20.61%
Quarterly Results Snapshot (Consolidated) - Mar'26 - QoQ

QoQ Growth in quarter ended Mar 2026 is -10.73% vs 39.33% in Dec 2025
QoQ Growth in quarter ended Mar 2026 is -26.88% vs 23.03% in Dec 2025
Half Yearly Results Snapshot (Consolidated) - Sep'25

Growth in half year ended Sep 2025 is -5.59% vs -36.27% in Sep 2024
Growth in half year ended Sep 2025 is 0.48% vs -24.98% in Sep 2024
Nine Monthly Results Snapshot (Consolidated) - Dec'25
YoY Growth in nine months ended Dec 2025 is 12.17% vs -40.79% in Dec 2024
YoY Growth in nine months ended Dec 2025 is 14.56% vs -31.85% in Dec 2024
Annual Results Snapshot (Consolidated) - Mar'26
YoY Growth in year ended Mar 2026 is 14.77% vs 35.47% in Mar 2025
YoY Growth in year ended Mar 2026 is 11.70% vs -12.29% in Mar 2025
About CP Capital Limited

Company Coordinates


