
Compare CP Capital with Similar Stocks
Stock DNA
Other Consumer Services
INR 200 Cr (Micro Cap)
5.00
180
0.00%
0.13
7.43%
0.34
Total Returns (Price + Dividend) 
Latest dividend: 1 per share ex-dividend date: Feb-21-2025
Risk Adjusted Returns v/s
Returns Beta

News
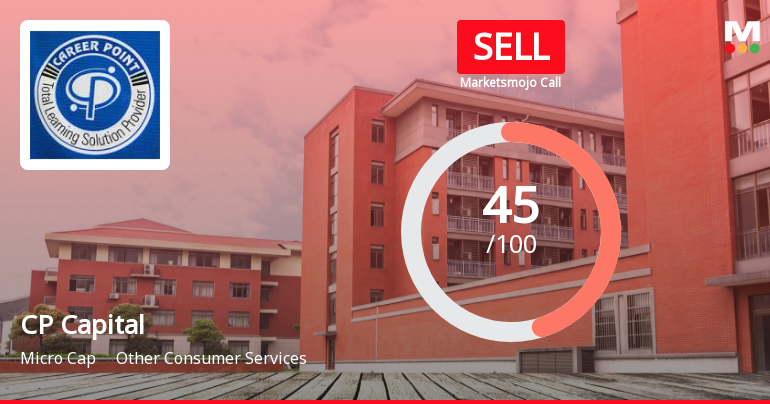
CP Capital Limited is Rated Sell by MarketsMOJO
CP Capital Limited is rated Sell by MarketsMOJO. This rating was last updated on 07 Apr 2025. However, the analysis and financial metrics discussed below reflect the stock’s current position as of 15 July 2026, providing investors with an up-to-date view of the company’s fundamentals, returns, and technical outlook.
Read full news article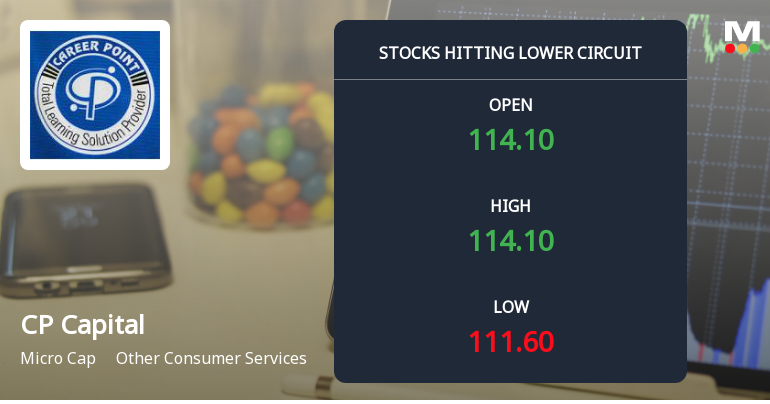
CP Capital Limited Locks at Lower Circuit With 5% Loss — Sellers Queue, No Buyers in Sight
At Rs 109.51, sellers were still queuing — but there were no buyers willing to take the other side. CP Capital Limited locked at its lower circuit of 5% on 10 Jul 2026, with unfilled sell orders and a frozen price, reflecting persistent selling pressure in a micro-cap stock with limited liquidity.
Read full news article
CP Capital Limited is Rated Sell by MarketsMOJO
CP Capital Limited is rated 'Sell' by MarketsMOJO, with this rating last updated on 07 April 2025. However, the analysis and financial metrics discussed below reflect the company’s current position as of 04 July 2026, providing investors with an up-to-date view of the stock’s fundamentals, returns, and technical outlook.
Read full news article Announcements
Career Point Limited - Other General Purpose
21-Nov-2019 | Source : NSECareer Point Limited has informed the Exchange regardingáthe disclosure of Related Party Transactions prepared in accordance with applicable Accounting Standards for half year ended 30th September, 2019, pursuant to regulation 23(9) of SEBI (Listing Obligations and Disclosure Requirements) Regulations; .2015.
Career Point Limited - Updates
15-Nov-2019 | Source : NSECareer Point Limited has informed the Exchange regarding 'Management Commentary on Career Point Limited Q2 / H1 FY 2019-20 & Update on IL&FS Education (Schoolnet) Transaction'.
Career Point Limited - Record Date
14-Nov-2019 | Source : NSECareer Point Limited has informed the Exchange that the Company has fixed Record Date as November 26, 2019 for the purpose of payment of interim dividend.
Corporate Actions

No Upcoming Board Meetings

CP Capital Limited has declared 10% dividend, ex-date: 21 Feb 25

No Splits history available

No Bonus history available

No Rights history available
Quality key factors
Valuation key factors
Technicals key factors
 Technical Indicator Scale: Bearish, Mildly Bearish, Sideways, Mildly Bullish, Bullish Turned
 Shareholding Snapshot : Mar 2026
Shareholding Compare (%holding)
Promoters
None
Held by 0 Schemes
Held by 1 FIIs (0.05%)
Kailash Bai (14.73%)
Manish Jain (3.16%)
20.61%
Quarterly Results Snapshot (Consolidated) - Mar'26 - QoQ

QoQ Growth in quarter ended Mar 2026 is -10.73% vs 39.33% in Dec 2025
QoQ Growth in quarter ended Mar 2026 is -26.88% vs 23.03% in Dec 2025
Half Yearly Results Snapshot (Consolidated) - Sep'25

Growth in half year ended Sep 2025 is -5.59% vs -36.27% in Sep 2024
Growth in half year ended Sep 2025 is 0.48% vs -24.98% in Sep 2024
Nine Monthly Results Snapshot (Consolidated) - Dec'25
YoY Growth in nine months ended Dec 2025 is 12.17% vs -40.79% in Dec 2024
YoY Growth in nine months ended Dec 2025 is 14.56% vs -31.85% in Dec 2024
Annual Results Snapshot (Consolidated) - Mar'26
YoY Growth in year ended Mar 2026 is 14.77% vs 35.47% in Mar 2025
YoY Growth in year ended Mar 2026 is 11.70% vs -12.29% in Mar 2025
About CP Capital Limited

Company Coordinates


