Craftsman Auto

  • Market Cap: Small Cap
  • Industry: Auto Components & Equipments
  • ISIN: INE00LO01017
  • NSEID: CRAFTSMAN
  • BSEID: 543276
INR
11,194.80
66.8 (0.6%)
BSENSE

Aug 31, 03:30 PM

BSE+NSE Vol: 2.35 lacs

  • Price Points
  • Score
  • Mojo Parameters
  • Total Return
  • News and Corporate Actions
  • Key factors
  • Shareholding
  • Financials
  • CompanyCV
stock-summaryPrice Point
High/Low

1Day

52 Week

Valuation
Technical
Day's Volume

CASH

2.35 lacs (194.56%) Volume

Shareholding (Jun 2026)

FII

17.28%

Held by 187 FIIs

DII

32.90%

Held by 37 DIIs

Promoter

42.41%

Why is Craftsman Automation Ltd falling/rising?

31-Aug-2026

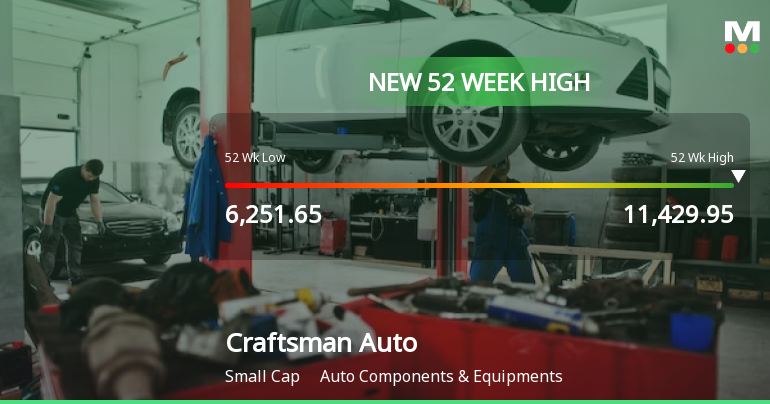
As of 30-Aug, Craftsman Automation Ltd's stock price is rising to Rs. 11,128.00, up 2.2%, driven by strong historical performance, positive financial results, and increased investor interest, including a recent 52-week high. The stock has outperformed the Sensex and its sector, indicating a positive trend and heightened trading activity.

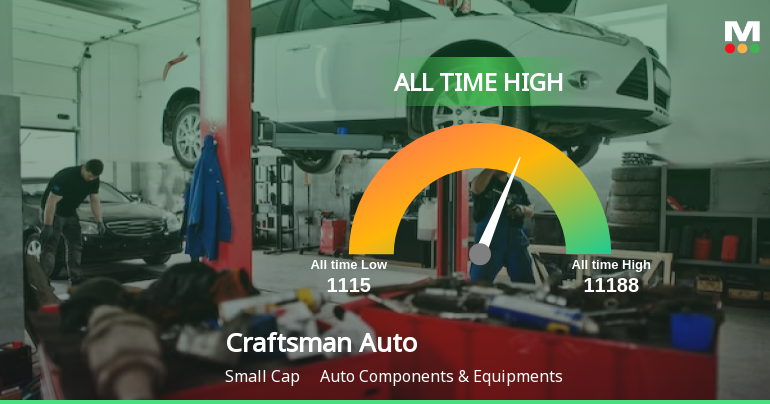
As of 30-Aug, Craftsman Automation Ltd's stock price is rising, currently at Rs. 11,128.00, reflecting an increase of Rs. 239.6 or 2.2%. This upward movement can be attributed to several key factors. Firstly, the stock has shown strong performance over various time frames, with a remarkable 59.56% increase over the past year, significantly outperforming the Sensex, which has declined by 3.52% in the same period. Additionally, the stock has gained 4.59% over the past week, while the benchmark has fallen by 0.36%.<BR><BR>Today, Craftsman Automation hit a new 52-week and all-time high of Rs. 11,188, indicating strong investor interest. The stock has been on a consecutive gain streak for the last three days, accumulating a total return of 6.92% during this period. Furthermore, it has outperformed its sector by 1.13% today, and it is trading above its moving averages across multiple time frames, suggesting a positive trend.<BR><BR>Investor participation has also increased, with delivery volume rising by 127.78% compared to the five-day average, indicating heightened trading activity and interest in the stock. The company's financial performance supports this rise, as it has reported healthy long-term growth, with net sales increasing at an annual rate of 36.61% and a net profit growth of 29.12%. The company has consistently declared positive results for the last five quarters, reinforcing investor confidence.<BR><BR>In summary, the combination of strong historical performance, positive financial results, increased investor participation, and the achievement of new price milestones are driving the rise in Craftsman Automation Ltd's stock price.

View full answer

Who are in the management team of Craftsman Auto?

14-Aug-2026

The management team of Craftsman Auto includes Srinivasan Ravi (Chairman & Managing Director), Ravi Gauthamram (Whole-time Director), K Sundararaman, Vijaya Sampath, Tamrapami Srinivasan Venkata Rajagopa, Rajeswari Karthigeyan (all Independent Directors), and Shainshad Aduvanni (Company Secretary & Compliance Officer). They oversee the company's strategic direction and regulatory compliance.

The management team of Craftsman Auto includes the following individuals:<BR><BR>1. **Srinivasan Ravi** - Chairman & Managing Director<BR>2. **Ravi Gauthamram** - Whole-time Director<BR>3. **K Sundararaman** - Non-Executive & Independent Director<BR>4. **Vijaya Sampath** - Non-Executive & Independent Director<BR>5. **Shainshad Aduvanni** - Company Secretary & Compliance Officer<BR>6. **Tamrapami Srinivasan Venkata Rajagopa** - Independent Director<BR>7. **Rajeswari Karthigeyan** - Independent Director<BR><BR>This team is responsible for guiding the company's strategic direction and ensuring compliance with regulatory standards.

View full answer

What does Craftsman Auto do?

14-Aug-2026

Craftsman Automation Ltd is a diversified engineering company specializing in manufacturing auto components and providing contract manufacturing services. As of June 2026, it reported net sales of ₹2,432 Cr and a net profit of ₹151 Cr, with a market cap of ₹27,248 Cr.

Overview:<BR>Craftsman Automation Ltd is a diversified engineering company engaged in manufacturing engineering components, sub-assemblies, and providing contract manufacturing services within the Auto Components & Equipments industry, categorized as a Small Cap company.<BR><BR>History:<BR>Craftsman Automation Ltd was incorporated on July 18, 1986. The latest quarterly results reported net sales and net profit for June 2026.<BR><BR>Financial Snapshot:<BR>- Net Sales: 2,432 Cr (Quarterly Results - Jun 2026)<BR>- Net Profit: 151 Cr (Quarterly Results - Jun 2026)<BR>- Market Cap: INR 27,248 Cr (Small Cap)<BR><BR>Key Metrics:<BR>- P/E: 58.00<BR>- Industry P/E: 36<BR>- Dividend Yield: 0.10%<BR>- Debt-Equity: 1.06<BR>- Return on Equity: 12.06%<BR>- Price to Book: 8.45<BR><BR>Contact Details:<BR>Address: Senthel Towers IV Floor, 1078 Avanashi Road Coimbatore Tamil Nadu : 641018<BR>Tel: 91-422-7165000<BR>Email: investor@craftsmanautomation.com<BR>Website: http://www.craftsmanautomation.com

View full answer

Who are the peers of the Craftsman Auto?

14-Aug-2026

Craftsman Auto's peers include Tube Investments, Sona BLW Precis., Endurance Tech, Exide Inds., ZF Commercial, Motherson Wiring, Gabriel India, Sundram Fasten., and Belrise Industri. Craftsman Auto has excellent growth and average capital structure, with a 1-year return of 47.92%.

Peers: The peers of Craftsman Auto are Tube Investments, Sona BLW Precis., Endurance Tech, Exide Inds., ZF Commercial, Motherson Wiring, Gabriel India, Sundram Fasten., and Belrise Industri.<BR><BR>Quality Snapshot: Excellent management risk is observed at Gabriel India and Motherson Wiring, while Good management risk is found at Tube Investments, Sona BLW Precis., Endurance Tech, Exide Inds., ZF Commercial, Craftsman Auto, Sundram Fasten., and Sansera Enginee. Average management risk is noted at Belrise Industri. Growth ratings show Excellent growth at Craftsman Auto and Gabriel India, Average growth at Endurance Tech and ZF Commercial, and Below Average growth at Sona BLW Precis., Exide Inds., Motherson Wiring, and Sundram Fasten. Capital Structure is Excellent for Tube Investments, Sona BLW Precis., Endurance Tech, Exide Inds., ZF Commercial, Motherson Wiring, and Gabriel India, while Craftsman Auto and Belrise Industri have Average capital structure.<BR><BR>Return Snapshot: The peer with the highest 1-year return is Sansera Enginee at 194.77%, while the lowest is Tube Investments at -9.33%. Craftsman Auto's 1-year return of 47.92% is significantly higher than Tube Investments but lower than Sansera Enginee. Additionally, Motherson Wiring and ZF Commercial have negative six-month returns.

View full answer

How big is Craftsman Auto?

14-Aug-2026

As of 14th August, Craftsman Automation Ltd has a market capitalization of 26,709.04 Cr, with net sales of 8,716.85 Cr and a net profit of 464.94 Cr in the latest four quarters. The company reported shareholder's funds of 3,264.06 Cr and total assets of 8,978.30 Cr for the annual period ending in March 2026.

As of 14th August, Craftsman Automation Ltd has a market capitalization of 26,709.04 Cr, categorizing it as a Small Cap company.<BR><BR>In the latest four quarters, Craftsman Automation Ltd reported net sales of 8,716.85 Cr and a net profit of 464.94 Cr.<BR><BR>For the latest annual period ending in March 2026, the company had shareholder's funds amounting to 3,264.06 Cr and total assets of 8,978.30 Cr.

View full answer

Are Craftsman Automation Ltd latest results good or bad?

30-Jul-2026

Craftsman Automation Ltd's latest Q1 FY27 results are strong, with a net profit increase of 116.31% year-on-year and record revenue growth of 36.30%. While the performance is positive, the stock's high P/E ratio suggests caution for investors.

Craftsman Automation Ltd's latest results for Q1 FY27 are quite strong, indicating a positive performance overall. The company reported a net profit of ₹150.55 crore, which is a remarkable increase of 116.31% year-on-year and a 29.32% increase from the previous quarter. Additionally, revenue grew by 36.30% year-on-year and 9.22% quarter-on-quarter, reaching ₹2,431.58 crore, marking the highest quarterly revenue in the company's history.<BR><BR>The operating margin also showed improvement, standing at 15.79%, which is up 94 basis points compared to the same quarter last year, although it is slightly lower than the previous quarter's margin of 16.10%. The net profit margin expanded significantly to 6.19% from 3.90% a year ago, reflecting enhanced operational efficiency.<BR><BR>Despite these strong results, the company's stock is trading at a premium valuation, with a P/E ratio of 56 times trailing earnings. This has led to a "BUY" rating but with a cautious score of 78 out of 100, down from a previous "STRONG BUY." The stock has performed exceptionally well over the past year, delivering a return of 53.62%, significantly outperforming the broader market.<BR><BR>In summary, Craftsman Automation's latest results reflect a robust growth trajectory, effective cost management, and operational improvements, making the overall performance good, though investors should be mindful of the high valuation and leverage concerns.

View full answer

Should I buy, sell or hold Craftsman Automation Ltd?

30-Jul-2026

Is Craftsman Auto technically bullish or bearish?

02-Dec-2025

As of December 1, 2025, Craftsman Auto's technical trend is mildly bullish, supported by daily moving averages and a bullish monthly MACD, despite mixed signals from weekly indicators.

As of 1 December 2025, the technical trend for Craftsman Auto has changed from bullish to mildly bullish. The weekly MACD is mildly bearish, while the monthly MACD remains bullish, indicating mixed signals across time frames. The daily moving averages are bullish, supporting a positive short-term outlook. However, the weekly KST is mildly bearish, and both the weekly and monthly RSI show no signal, suggesting a lack of momentum. The Bollinger Bands indicate a sideways trend on the weekly chart but are bullish on the monthly. Overall, the current technical stance is mildly bullish, driven primarily by the daily moving averages and the monthly MACD, despite some bearish signals in the weekly indicators.

View full answer

How has been the historical performance of Craftsman Auto?

24-Nov-2025

Craftsman Auto has experienced significant growth in net sales, rising from 1,492.46 Cr in March 2020 to 5,690.48 Cr in March 2025, despite fluctuations in profitability metrics. Total assets increased to 7,116.44 Cr in March 2025, indicating robust growth, although profit before tax and profit after tax declined in the latest fiscal year.

Answer:<BR>The historical performance of Craftsman Auto shows significant growth in net sales and profitability over the years, with a notable increase in revenue and net profit in the latest fiscal year.<BR><BR>Breakdown:<BR>Craftsman Auto's net sales have risen dramatically from 1,492.46 Cr in March 2020 to 5,690.48 Cr in March 2025, reflecting a strong upward trend. Total operating income has followed a similar trajectory, reaching 5,690.48 Cr in March 2025, up from 1,492.46 Cr in March 2020. The company's total expenditure has also increased, amounting to 4,857.77 Cr in March 2025, which is a rise from 1,094.49 Cr in March 2020. Operating profit (PBDIT) has shown fluctuations, peaking at 857.78 Cr in March 2025, down from 896.07 Cr in March 2024. Profit before tax decreased to 268.65 Cr in March 2025 from 443.84 Cr in March 2024, while profit after tax also declined to 199.87 Cr in March 2025 from 336.48 Cr in March 2024. The company's total assets have increased significantly to 7,116.44 Cr in March 2025, compared to 2,307.28 Cr in March 2020, indicating robust growth. Total liabilities have also risen to 7,116.44 Cr in March 2025, up from 2,307.28 Cr in March 2020. Cash flow from operating activities has decreased to 283.00 Cr in March 2025 from 513.00 Cr in March 2024, while cash flow from investing activities has seen a substantial outflow of -1,642.00 Cr in March 2025. Overall, Craftsman Auto has demonstrated strong growth in sales and assets, although profitability metrics have shown some volatility in recent years.

View full answer

Is Craftsman Auto overvalued or undervalued?

11-Nov-2025

As of November 10, 2025, Craftsman Auto is fairly valued with a PE ratio of 61.83, an EV to EBITDA of 28.19, and a Price to Book Value of 0.54, indicating strong market performance and efficient valuation compared to peers, despite a high PE ratio.

As of 10 November 2025, Craftsman Auto's valuation grade has moved from expensive to fair, indicating a more favorable assessment of its market position. The company appears to be fairly valued at this time. Key ratios include a PE ratio of 61.83, an EV to EBITDA of 28.19, and a Price to Book Value of 0.54, which suggest that while the PE ratio is high, the low Price to Book indicates potential undervaluation relative to its assets.<BR><BR>In comparison to its peers, Craftsman Auto's PE ratio is higher than Rail Vikas, which has a PE of 55.27, but lower than Tube Investments at 91.45. Additionally, Craftsman Auto's EV to EBITDA is significantly lower than that of Rail Vikas, which stands at 67.62, suggesting that Craftsman may be more efficiently valued in terms of earnings. The company's stock has outperformed the Sensex with a year-to-date return of 27.19% compared to the Sensex's 6.91%, reinforcing the notion that Craftsman Auto is positioned well within its industry despite its high PE ratio.

View full answer

Who are the top shareholders of the Craftsman Auto?

17-Jul-2025

The top shareholders of Craftsman Auto include promoter Srinivasan Ravi with 44.01%, mutual funds at 17.36%, foreign institutional investors at 15.64%, and the International Finance Corporation as the largest public shareholder with 4.24%. Individual investors collectively own 6.35% of the shares.

The top shareholders of Craftsman Auto include the promoters, who hold a majority stake in the company. The promoter with the highest holding is Srinivasan Ravi, who owns 44.01% of the shares. Additionally, mutual funds hold 17.36% of the company through 25 different schemes, while foreign institutional investors (FIIs) account for 15.64% through 130 FIIs. The highest public shareholder is the International Finance Corporation, which holds 4.24%. Individual investors collectively own 6.35% of the shares.

View full answer

When is the next results date for Craftsman Auto?

06-Jun-2025

No Upcoming Board Meetings

Has Craftsman Auto declared dividend?

06-Jun-2025

Craftsman Automation Ltd has declared a 225% dividend, amounting to ₹11.25 per share, with an ex-date of May 17, 2024. Despite a 0% dividend yield, the company has shown strong total returns over various periods, particularly in the long term.

Craftsman Automation Ltd has declared a 225% dividend.<BR><BR>Dividend Details:<BR>- Percentage announced: 225%<BR>- Amount per share: 11.25<BR>- Ex-date: May 17, 2024<BR><BR>Dividend Yield: 0%<BR><BR>Total Returns by Period:<BR>In the last 6 months, the price return was 13.7%, with a dividend return of 0%, resulting in a total return of 13.7%.<BR><BR>Over the past year, the price return was 30.69%, with a dividend return of 0%, leading to a total return of 30.69%.<BR><BR>In the last 2 years, the price return was 42.89%, with a dividend return of 0.56%, resulting in a total return of 43.45%.<BR><BR>For the 3-year period, the price return was 139.83%, with a dividend return of 1.06%, culminating in a total return of 140.89%.<BR><BR>Over the past 4 years, the price return was 213.23%, with a dividend return of 1.50%, leading to a total return of 214.73%.<BR><BR>In the last 5 years, the price return was 0%, with a dividend return of 0%, resulting in a total return of 0.0%.<BR><BR>The declaration of a substantial dividend of 225% indicates a positive outlook for Craftsman Automation Ltd, despite the dividend yield being 0%. The total returns over various periods show a strong performance, particularly in the longer terms, suggesting robust growth in the company's value.

View full answer
iScoreScore
Click here to find our call on this stock
Strong Sell
Sell
Hold
Buy
Strong Buy

Dashboard

1

Healthy long term growth as Net Sales has grown by an annual rate of 36.61% and Operating profit at 24.50%

 
2

With a growth in Net Profit of 29.12%, the company declared Very Positive results in Jun 26

3

Market Beating performance in long term as well as near term

stock-summaryMojo Parameters

Mojo Parameters

Loading Valuation Snapshot...

Stock DNA

stock-summary
Industry

Auto Components & Equipments

stock-summary
Market cap

INR 28,760 Cr (Small Cap)

stock-summary
P/E

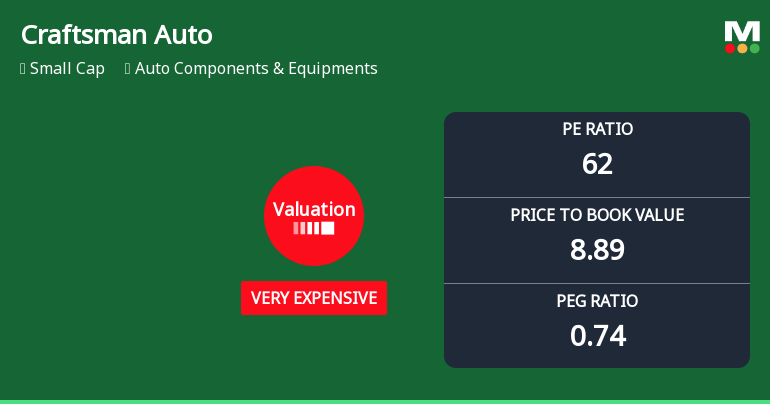
63.00

stock-summary
Industry P/E

35

stock-summary
Dividend Yield

0.09%

stock-summary
Debt Equity

1.06

stock-summary
Return on Equity

12.06%

stock-summary
Price to Book

8.89

Revenue and Profits:
Net Sales:
2,432 Cr
(Quarterly Results - Jun 2026)
Net Profit:
151 Cr
stock-summaryTotal Returns
Total Returns (Price + Dividend) stock-summary
Dividend Yield (0.09%)
TimePeriod
Price Return
Dividend Return
Total Return
3 Months
23.24%
0.13%
23.37%
6 Months
45.9%
0.15%
46.05%
1 Year
62.44%
0.16%
62.6%
2 Years
85.42%
0.27%
85.69%
3 Years
124.91%
0.58%
125.49%
4 Years
328.5%
1.37%
329.87%
5 Years
479.4%
2.01%
481.41%

Latest dividend: 11.25 per share ex-dividend date: Jul-16-2026

Risk Adjusted Returns v/s stock-summary
Returns Beta
Icon
Beta has not been calculated since enough price history is not available
stock-summaryNews & Corporate Actions

Announcements stock-summary

Intimation Under Regulation 30 Of The Securities And Exchange Board Of India (Listing Obligations And Disclosure Requirements) Regulations 2015 - Incorporation Of Step-Down Wholly Owned Subsidiary In Germany

28-Aug-2026 | Source : BSE

Pursuant to Regulation 30 read with Schedule III of the SEBI (LODR) Regulations 2015 and with reference to our earlier intimation dated 21st August 2026 regarding approval for incorporation of Craftsman Fronberg Precision GmbH Germany we wish to inform you that Craftsman Fronberg Precision GmbH has been incorporated in Germany on 27th August 2026 as a Wholly Owned Subsidiary of Craftsman Germany GmbH a Wholly Owned Subsidiary of the Company.

Intimation Under Regulation 30 Of The SEBI (Listing Obligations And Disclosure Requirements) Regulations 2015 - Approval For Incorporation Of Step-Down Wholly Owned Subsidiary In Germany

21-Aug-2026 | Source : BSE

Pursuant to Regulation 30 of the SEBI (LODR) Regulations 2015 We wish to inform you that the Board of Directors of the Company by way of Circular resolution dated 21st August 2026 approved the proposal for incorporation of Craftsman Fronberg Precision GmbH in Germany by Craftsman Germany GmbH a Wholly Owned Subsidiary of the Company subject to completion of statutory and regulatory formalities and such approvals as may be required under applicable laws.

Announcement under Regulation 30 (LODR)-Analyst / Investor Meet - Intimation

10-Aug-2026 | Source : BSE

Pursuant to Regulation 30 read with Part A of Schedule III of the Securities and Exchange Board of India (Listing Obligations and Disclosure Requirements) Regulations 2015 we wish to inform you that a representative of the Company will be participating in the conference organised by Avendus Spark INDX - Asia Edition.

Corporate Actions stock-summary

stock-summary
BOARD MEETING

No Upcoming Board Meetings

stock-summary
DIVIDEND

Craftsman Automation Ltd has declared 225% dividend, ex-date: 16 Jul 26

stock-summary
SPLITS

No Splits history available

stock-summary
BONUS

No Bonus history available

stock-summary
RIGHTS

No Rights history available

stock-summaryKey Factors

Quality key factors stock-summary

Factor
Value
Sales Growth (5y)
36.61%
EBIT Growth (5y)
24.50%
EBIT to Interest (avg)
3.23
Debt to EBITDA (avg)
2.14
Net Debt to Equity (avg)
1.06
Sales to Capital Employed (avg)
1.17
Tax Ratio
27.54%
Dividend Payout Ratio
6.13%
Pledged Shares
0
Institutional Holding
50.18%
ROCE (avg)
15.42%
ROE (avg)
14.04%

Valuation key factors

Factor
Value
P/E Ratio
63
Industry P/E
35
Price to Book Value
9.01
EV to EBIT
36.76
EV to EBITDA
24.23
EV to Capital Employed
4.90
EV to Sales
3.77
PEG Ratio
0.75
Dividend Yield
0.09%
ROCE (Latest)
11.83%
ROE (Latest)
12.06%

Technicals key factors

Indicator
Weekly
Monthly
MACD
Bullish
Bullish
RSI
No Signal
Bearish
Bollinger Bands
Bullish
Bullish
Moving Averages
Bullish (Daily)
KST
Bullish
Bullish
Dow Theory
Bullish
Bullish
OBV
No Trend
Mildly Bullish
stock-summary Technical Indicator Scale: Bearish, Mildly Bearish, Sideways, Mildly Bullish, Bullish  Turned 
stock-summaryShareholding
Shareholding Snapshot : Jun 2026stock-summary
Shareholding Compare (%holding) stock-summary
Majority shareholders

Promoters

Pledged Promoter Holdings

None

Mutual Funds

Held by 32 Schemes (23.82%)

FIIs

Held by 187 FIIs (17.28%)

Promoter with highest holding

Mr. Srinivasan Ravi (38.14%)

Highest Public shareholder

Axis Mutual Fund Trustee Limited A/c Axis Mutual Fund A/c Axis Small Cap Fund (4.19%)

Individual Investors Holdings

5.45%

stock-summaryFinancial
[
  {
    "link": "quarterly",
    "btn_text": "All Quarterly Results",
    "header": "Quarterly Results Snapshot (Consolidated) - Jun'26 - QoQ",
    "rhs": [
      {
        "prefix": "Net Sales ",
        "suffix": "QoQ Growth in quarter ended Jun 2026 is 9.22% vs 8.22% in Mar 2026",
        "dir": 1
      },
      {
        "prefix": "Consolidated Net Profit ",
        "suffix": "QoQ Growth in quarter ended Jun 2026 is 29.32% vs 8.69% in Mar 2026",
        "dir": 1
      }
    ],
    "table": {
      "header": [
        "Jun'26",
        "Mar'26",
        "Change(%)"
      ],
      "body": [
        {
          "field": "Net Sales",
          "val1": "2,431.58",
          "val2": "2,226.40",
          "chgp": "9.22%",
          "chgp_class": "positive"
        },
        {
          "field": "Operating Profit (PBDIT) excl Other Income",
          "val1": "383.87",
          "val2": "358.53",
          "chgp": "7.07%",
          "chgp_class": "positive"
        },
        {
          "field": "Interest",
          "val1": "86.16",
          "val2": "86.27",
          "chgp": "-0.13%",
          "chgp_class": "positive"
        },
        {
          "field": "Exceptional Items",
          "val1": "0.00",
          "val2": "-0.54",
          "chgp": "100.00%",
          "chgp_class": "positive"
        },
        {
          "field": "Consolidate Net Profit",
          "val1": "150.55",
          "val2": "116.42",
          "chgp": "29.32%",
          "chgp_class": "positive"
        },
        {
          "field": "Operating Profit Margin (Excl OI)",
          "val1": "15.79%",
          "val2": "16.10%",
          "chgp": "-0.31%",
          "chgp_class": "negative"
        }
      ]
    }
  },
  {
    "link": "half-yearly",
    "btn_text": "All Half Yearly Results",
    "header": "Half Yearly Results Snapshot (Consolidated) - Sep'25",
    "rhs": [
      {
        "prefix": "Net Sales ",
        "suffix": " Growth in half year ended Sep 2025 is 60.06% vs 6.70% in Sep 2024",
        "dir": 1
      },
      {
        "prefix": "Consolidated Net Profit ",
        "suffix": " Growth in half year ended Sep 2025 is 39.68% vs -32.03% in Sep 2024",
        "dir": 1
      }
    ],
    "table": {
      "header": [
        "Sep'25",
        "Sep'24",
        "Change(%)"
      ],
      "body": [
        {
          "field": "Net Sales",
          "val1": "3,785.59",
          "val2": "2,365.14",
          "chgp": "60.06%",
          "chgp_class": "positive"
        },
        {
          "field": "Operating Profit (PBDIT) excl Other Income",
          "val1": "566.84",
          "val2": "390.11",
          "chgp": "45.30%",
          "chgp_class": "positive"
        },
        {
          "field": "Interest",
          "val1": "143.31",
          "val2": "90.47",
          "chgp": "58.41%",
          "chgp_class": "negative"
        },
        {
          "field": "Exceptional Items",
          "val1": "-8.73",
          "val2": "0.00",
          "chgp": "",
          "chgp_class": "neutral"
        },
        {
          "field": "Consolidate Net Profit",
          "val1": "160.46",
          "val2": "114.88",
          "chgp": "39.68%",
          "chgp_class": "positive"
        },
        {
          "field": "Operating Profit Margin (Excl OI)",
          "val1": "14.97%",
          "val2": "16.49%",
          "chgp": "-1.52%",
          "chgp_class": "negative"
        }
      ]
    }
  },
  {
    "link": "nine-monthly",
    "btn_text": "All Nine Monthly Results",
    "header": "Nine Monthly Results Snapshot (Consolidated) - Dec'25",
    "rhs": [
      {
        "prefix": "Net Sales ",
        "suffix": "YoY Growth in nine months ended Dec 2025 is 48.25% vs 17.78% in Dec 2024",
        "dir": 1
      },
      {
        "prefix": "Consolidated Net Profit ",
        "suffix": "YoY Growth in nine months ended Dec 2025 is 109.35% vs -47.22% in Dec 2024",
        "dir": 1
      }
    ],
    "table": {
      "header": [
        "Dec'25",
        "Dec'24",
        "Change(%)"
      ],
      "body": [
        {
          "field": "Net Sales",
          "val1": "5,842.87",
          "val2": "3,941.23",
          "chgp": "48.25%",
          "chgp_class": "positive"
        },
        {
          "field": "Operating Profit (PBDIT) excl Other Income",
          "val1": "879.06",
          "val2": "589.09",
          "chgp": "49.22%",
          "chgp_class": "positive"
        },
        {
          "field": "Interest",
          "val1": "222.70",
          "val2": "148.72",
          "chgp": "49.74%",
          "chgp_class": "negative"
        },
        {
          "field": "Exceptional Items",
          "val1": "-12.41",
          "val2": "-14.76",
          "chgp": "15.92%",
          "chgp_class": "positive"
        },
        {
          "field": "Consolidate Net Profit",
          "val1": "267.57",
          "val2": "127.81",
          "chgp": "109.35%",
          "chgp_class": "positive"
        },
        {
          "field": "Operating Profit Margin (Excl OI)",
          "val1": "15.05%",
          "val2": "14.95%",
          "chgp": "0.10%",
          "chgp_class": "positive"
        }
      ]
    }
  },
  {
    "link": "annual",
    "btn_text": "All Annual Results",
    "header": "Annual Results Snapshot (Consolidated) - Mar'26",
    "rhs": [
      {
        "prefix": "Net Sales ",
        "suffix": "YoY Growth in year ended Mar 2026 is 41.80% vs 27.83% in Mar 2025",
        "dir": 1
      },
      {
        "prefix": "Consolidated Net Profit ",
        "suffix": "YoY Growth in year ended Mar 2026 is 97.35% vs -36.10% in Mar 2025",
        "dir": 1
      }
    ],
    "table": {
      "header": [
        "Mar'26",
        "Mar'25",
        "Change(%)"
      ],
      "body": [
        {
          "field": "Net Sales",
          "val1": "8,069.27",
          "val2": "5,690.48",
          "chgp": "41.80%",
          "chgp_class": "positive"
        },
        {
          "field": "Operating Profit (PBDIT) excl Other Income",
          "val1": "1,237.59",
          "val2": "832.71",
          "chgp": "48.62%",
          "chgp_class": "positive"
        },
        {
          "field": "Interest",
          "val1": "308.97",
          "val2": "216.64",
          "chgp": "42.62%",
          "chgp_class": "negative"
        },
        {
          "field": "Exceptional Items",
          "val1": "-12.95",
          "val2": "-25.47",
          "chgp": "49.16%",
          "chgp_class": "positive"
        },
        {
          "field": "Consolidate Net Profit",
          "val1": "383.99",
          "val2": "194.57",
          "chgp": "97.35%",
          "chgp_class": "positive"
        },
        {
          "field": "Operating Profit Margin (Excl OI)",
          "val1": "15.34%",
          "val2": "14.63%",
          "chgp": "0.71%",
          "chgp_class": "positive"
        }
      ]
    }
  }
]

Quarterly Results Snapshot (Consolidated) - Jun'26 - QoQstock-summary

Jun'26
Mar'26
Change(%)
Net Sales
2,431.58
2,226.40
9.22%
Operating Profit (PBDIT) excl Other Income
383.87
358.53
7.07%
Interest
86.16
86.27
-0.13%
Exceptional Items
0.00
-0.54
100.00%
Consolidate Net Profit
150.55
116.42
29.32%
Operating Profit Margin (Excl OI)
15.79%
16.10%
-0.31%
Values in Rs Cr.
Direction Arrows
Net Sales

QoQ Growth in quarter ended Jun 2026 is 9.22% vs 8.22% in Mar 2026

Direction Arrows
Consolidated Net Profit

QoQ Growth in quarter ended Jun 2026 is 29.32% vs 8.69% in Mar 2026

Half Yearly Results Snapshot (Consolidated) - Sep'25stock-summary

Sep'25
Sep'24
Change(%)
Net Sales
3,785.59
2,365.14
60.06%
Operating Profit (PBDIT) excl Other Income
566.84
390.11
45.30%
Interest
143.31
90.47
58.41%
Exceptional Items
-8.73
0.00
Consolidate Net Profit
160.46
114.88
39.68%
Operating Profit Margin (Excl OI)
14.97%
16.49%
-1.52%
Values in Rs Cr.
Direction Arrows
Net Sales

Growth in half year ended Sep 2025 is 60.06% vs 6.70% in Sep 2024

Direction Arrows
Consolidated Net Profit

Growth in half year ended Sep 2025 is 39.68% vs -32.03% in Sep 2024

Nine Monthly Results Snapshot (Consolidated) - Dec'25stock-summary

Dec'25
Dec'24
Change(%)
Net Sales
5,842.87
3,941.23
48.25%
Operating Profit (PBDIT) excl Other Income
879.06
589.09
49.22%
Interest
222.70
148.72
49.74%
Exceptional Items
-12.41
-14.76
15.92%
Consolidate Net Profit
267.57
127.81
109.35%
Operating Profit Margin (Excl OI)
15.05%
14.95%
0.10%
Values in Rs Cr.
Direction Arrows
Net Sales

YoY Growth in nine months ended Dec 2025 is 48.25% vs 17.78% in Dec 2024

Direction Arrows
Consolidated Net Profit

YoY Growth in nine months ended Dec 2025 is 109.35% vs -47.22% in Dec 2024

Annual Results Snapshot (Consolidated) - Mar'26stock-summary

Mar'26
Mar'25
Change(%)
Net Sales
8,069.27
5,690.48
41.80%
Operating Profit (PBDIT) excl Other Income
1,237.59
832.71
48.62%
Interest
308.97
216.64
42.62%
Exceptional Items
-12.95
-25.47
49.16%
Consolidate Net Profit
383.99
194.57
97.35%
Operating Profit Margin (Excl OI)
15.34%
14.63%
0.71%
Values in Rs Cr.
Direction Arrows
Net Sales

YoY Growth in year ended Mar 2026 is 41.80% vs 27.83% in Mar 2025

Direction Arrows
Consolidated Net Profit

YoY Growth in year ended Mar 2026 is 97.35% vs -36.10% in Mar 2025

stock-summaryCompany CV
About Craftsman Automation Ltd stock-summary
stock-summary
Craftsman Automation Ltd
Small Cap
Auto Components & Equipments
Craftsman Automation Limited was incorporated on July 18, 1986. The Company is a diversified engineering company with vertically integrated manufacturing capabilities, engaged in in the business of manufacturing engineering components, sub-assemblies, products and rendering of contract manufacturing services to various industries. The Company has a total built up area of over 1.5 million sq. ft.
Company Coordinates stock-summary
Company Details
Senthel Towers IV Floor, 1078 Avanashi Road Coimbatore Tamil Nadu : 641018
stock-summary
Tel: 91-422-7165000
stock-summary
investor@craftsmanautomation.com
Registrar Details