
Compare Credent Global with Similar Stocks
Dashboard
Strong Long Term Fundamental Strength with a 46.49% CAGR growth in Operating Profits
Healthy long term growth as Net Sales has grown by an annual rate of 33.21% and Operating profit at 46.49%
The company has declared Positive results for the last 5 consecutive quarters
With ROE of 18.2, it has a Very Attractive valuation with a 1.2 Price to Book Value
Falling Participation by Institutional Investors
Market Beating Performance
Stock DNA
Non Banking Financial Company (NBFC)
INR 177 Cr (Micro Cap)
7.00
20
0.00%
0.76
18.24%
1.28
Total Returns (Price + Dividend) 
Latest dividend: 0.5 per share ex-dividend date: Feb-21-2023
Risk Adjusted Returns v/s
Returns Beta

News
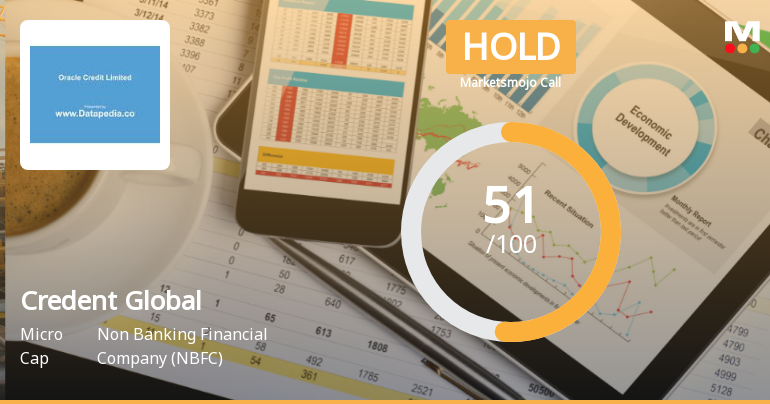
Credent Global Finance Ltd Upgraded to Hold on Improved Financial and Quality Metrics
Credent Global Finance Ltd, a micro-cap player in the Non Banking Financial Company (NBFC) sector, has seen its investment rating upgraded from Sell to Hold as of 2 June 2026. This change reflects a nuanced improvement across multiple parameters including financial trends, quality metrics, valuation, and technical indicators, signalling a cautiously optimistic outlook for investors.
Read full news article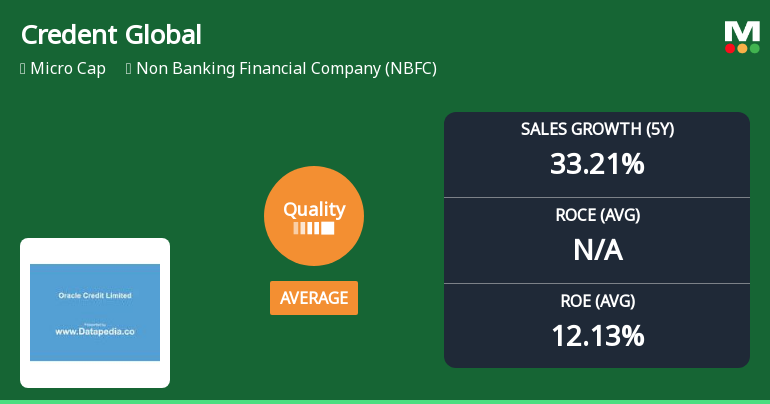
Credent Global Finance Ltd Upgrades Quality Grade Amid Improving Fundamentals
Credent Global Finance Ltd has seen its quality grade improve from below average to average, reflecting a nuanced shift in its business fundamentals. While key metrics such as return on equity and sales growth have strengthened, certain areas like debt levels and consistency warrant closer scrutiny as the company navigates a challenging NBFC landscape.
Read full news article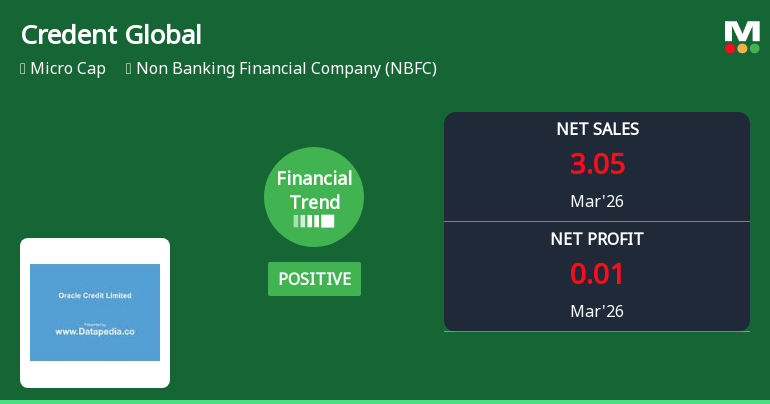
Credent Global Finance Ltd Reports Mixed Quarterly Results Amid Financial Trend Shift
Credent Global Finance Ltd, a micro-cap player in the Non Banking Financial Company (NBFC) sector, has reported a mixed set of quarterly results for March 2026, reflecting a notable shift in its financial trend from outstanding to positive. Despite some encouraging revenue and profit figures over the last six months, the latest quarter reveals significant margin pressures and operational challenges that have impacted key profitability metrics.
Read full news article Announcements
Announcement under Regulation 30 (LODR)-Newspaper Publication
01-Jun-2026 | Source : BSEEnclosed herewith Newspaper advertisement for Audited Standalone and Consolidated Financial Results for the Quarter and Year ender 31.03.2026.
Shareholder Meeting / Postal Ballot-Outcome of EGM
01-Jun-2026 | Source : BSEEnclosed herewith is the Proceedings of EGM of the Company held on 01st June 2026
Announcement under Regulation 30 (LODR)-Preferential Issue
30-May-2026 | Source : BSERevised outcome of Board Meeting held on May 29 2026.
Corporate Actions

No Upcoming Board Meetings

Credent Global Finance Ltd has declared 5% dividend, ex-date: 21 Feb 23

Credent Global Finance Ltd has announced 2:10 stock split, ex-date: 15 Oct 24

No Bonus history available

Credent Global Finance Ltd has announced 1:2 rights issue, ex-date: 17 Jul 23
Quality key factors
Valuation key factors
Technicals key factors
 Technical Indicator Scale: Bearish, Mildly Bearish, Sideways, Mildly Bullish, Bullish Turned
 Shareholding Snapshot : Mar 2026
Shareholding Compare (%holding)
Non Institution
None
Held by 0 Schemes
Held by 4 FIIs (15.86%)
Aditya Vikram Kanoria (13.14%)
Supriya Kataria (8.06%)
22.2%
Quarterly Results Snapshot (Consolidated) - Mar'26 - QoQ

QoQ Growth in quarter ended Mar 2026 is -88.21% vs 113.45% in Dec 2025
QoQ Growth in quarter ended Mar 2026 is -99.94% vs 146.70% in Dec 2025
Half Yearly Results Snapshot (Consolidated) - Sep'25

Growth in half year ended Sep 2025 is 79.66% vs 77.01% in Sep 2024
Growth in half year ended Sep 2025 is 174.70% vs -1,222.67% in Sep 2024
Nine Monthly Results Snapshot (Consolidated) - Dec'25
YoY Growth in nine months ended Dec 2025 is 248.20% vs 50.19% in Dec 2024
YoY Growth in nine months ended Dec 2025 is 349.00% vs -821.10% in Dec 2024
Annual Results Snapshot (Consolidated) - Mar'26
YoY Growth in year ended Mar 2026 is 197.41% vs 18.43% in Mar 2025
YoY Growth in year ended Mar 2026 is 471.07% vs -602.99% in Mar 2025
About Credent Global Finance Ltd

Company Coordinates


