
Compare Credo Brands with Similar Stocks
Stock DNA
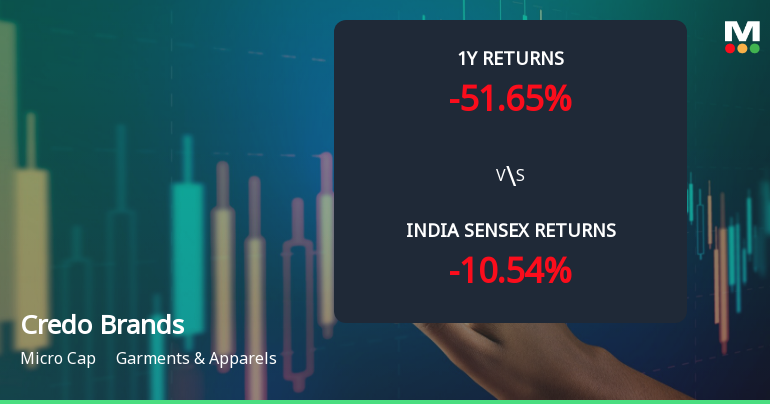
Garments & Apparels
INR 565 Cr (Micro Cap)
8.00
70
3.54%
0.47
16.67%
1.35
Total Returns (Price + Dividend) 
Latest dividend: 3 per share ex-dividend date: Sep-10-2025
Risk Adjusted Returns v/s
Returns Beta

News
Credo Brands Marketing Ltd Faces Mildly Bearish Momentum Amid Technical Shifts
Credo Brands Marketing Ltd, a micro-cap player in the Garments & Apparels sector, has experienced a notable shift in its technical momentum, moving from a sideways trend to a mildly bearish stance. This change is reflected in a combination of technical indicators, including MACD, RSI, moving averages, and Bollinger Bands, signalling a cautious outlook for investors amid recent price declines and sector headwinds.
Read full news article
Credo Brands Marketing Ltd Upgraded to Hold by MarketsMOJO on Technical Improvements
Credo Brands Marketing Ltd, a micro-cap player in the Garments & Apparels sector, has seen its investment rating upgraded from Sell to Hold as of 2 June 2026. This change reflects a nuanced improvement across technical indicators, valuation metrics, financial trends, and quality assessments, signalling a cautious but more optimistic outlook for investors.
Read full news article
Credo Brands Marketing Ltd Sees Technical Momentum Shift Amid Mixed Market Returns
Credo Brands Marketing Ltd, a micro-cap player in the Garments & Apparels sector, has exhibited a notable shift in price momentum and technical indicators, prompting a reassessment of its near-term outlook. The stock’s recent 7.43% gain to ₹89.16 from a previous close of ₹82.99 contrasts with its longer-term underperformance, signalling a complex technical landscape for investors to navigate.
Read full news article Announcements
Announcement under Regulation 30 (LODR)-Earnings Call Transcript
26-May-2026 | Source : BSETranscript of Earnings call held on May 22 2026
Announcement under Regulation 30 (LODR)-Newspaper Publication
23-May-2026 | Source : BSENewspaper publication of Audited Financial Results for quarter and year ended March 31 2026
Announcement under Regulation 30 (LODR)-Analyst / Investor Meet - Outcome
22-May-2026 | Source : BSEAudio recording of investor/analyst conference call on audited financial results of the Company for the quarter and year ended March 31 2026
Corporate Actions

No Upcoming Board Meetings

Credo Brands Marketing Ltd has declared 150% dividend, ex-date: 10 Sep 25

No Splits history available

No Bonus history available

No Rights history available
Quality key factors
Valuation key factors
Technicals key factors
 Technical Indicator Scale: Bearish, Mildly Bearish, Sideways, Mildly Bullish, Bullish Turned
 Shareholding Snapshot : Mar 2026
Shareholding Compare (%holding)
Promoters
None
Held by 1 Schemes (0.95%)
Held by 6 FIIs (0.46%)
Kamal D Khushlani (28.01%)
Bennett, Coleman And Company Limited (8.24%)
28.55%
Quarterly Results Snapshot (Standalone) - Mar'26 - QoQ

QoQ Growth in quarter ended Mar 2026 is 11.07% vs -10.75% in Dec 2025
QoQ Growth in quarter ended Mar 2026 is 116.95% vs -62.80% in Dec 2025
Half Yearly Results Snapshot (Standalone) - Sep'25

Growth in half year ended Sep 2025 is -8.33% vs 8.92% in Sep 2024
Growth in half year ended Sep 2025 is -30.50% vs -0.88% in Sep 2024
Nine Monthly Results Snapshot (Standalone) - Dec'25
YoY Growth in nine months ended Dec 2025 is -7.57% vs 7.08% in Dec 2024
YoY Growth in nine months ended Dec 2025 is -41.00% vs 4.68% in Dec 2024
Annual Results Snapshot (Standalone) - Mar'26
YoY Growth in year ended Mar 2026 is -4.22% vs 8.96% in Mar 2025
YoY Growth in year ended Mar 2026 is -30.68% vs 15.64% in Mar 2025
About Credo Brands Marketing Ltd

Company Coordinates


