
Compare Crestchem with Similar Stocks
Stock DNA
Specialty Chemicals
INR 41 Cr (Micro Cap)
15.00
42
0.70%
-0.13
33.58%
5.30
Total Returns (Price + Dividend) 
Latest dividend: 1 per share ex-dividend date: Aug-13-2025
Risk Adjusted Returns v/s
Returns Beta

News
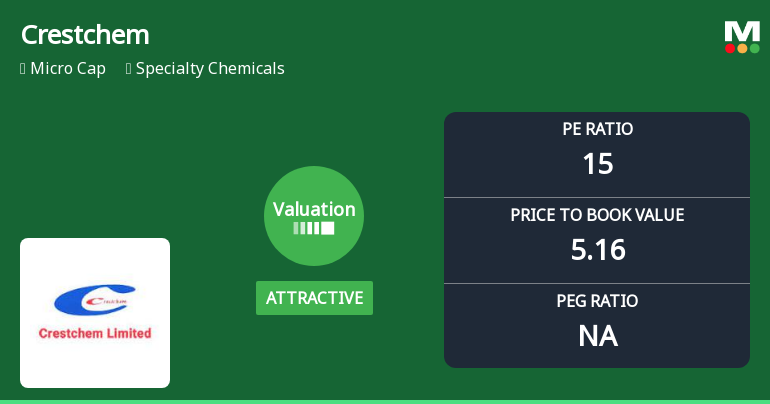
Crestchem Ltd Valuation Shift Signals Renewed Price Attractiveness Amid Specialty Chemicals Sector
Crestchem Ltd, a micro-cap player in the specialty chemicals sector, has witnessed a notable shift in its valuation parameters, moving from a very attractive to an attractive rating. This change reflects evolving market perceptions amid a strong price rally, with the stock outperforming the Sensex significantly over recent periods. Despite a modest upgrade in valuation grades, the company retains a Sell mojo grade, underscoring ongoing caution among analysts.
Read full news articleAre Crestchem Ltd latest results good or bad?
Crestchem Ltd's latest financial results for the quarter ended March 2026 highlight a significant operational milestone, with net sales reaching ₹10.23 crores, marking the highest quarterly revenue on record. The company's net profit for the same period was ₹1.10 crores, also a record high, supported by improved operational efficiency and cost management. The operating margin expanded to 13.78%, indicating enhanced profitability metrics compared to historical averages. However, a contrasting narrative emerges when examining the full financial year FY25. The company's total revenues were ₹25.00 crores, reflecting a year-on-year decline of 19.0%, while net profit remained flat at ₹2.00 crores. This inconsistency between the strong quarterly performance and the annual decline raises concerns about the sustainability of the recent gains and the predictability of future earnings. Crestchem's operational effici...
Read full news article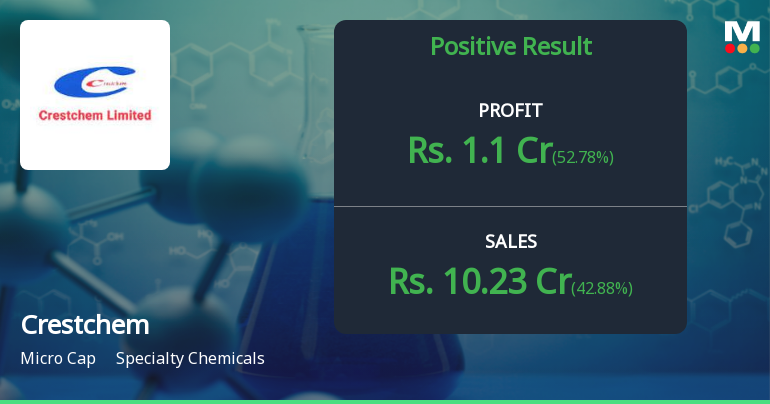
Crestchem Q4 FY26: Impressive Quarter Masks Troubling Annual Decline
Crestchem Ltd., a Gujarat-based specialty chemicals manufacturer, reported a stellar performance for the quarter ended March 2026, posting net profit of ₹1.10 crores on revenues of ₹10.23 crores. However, the quarterly strength stands in stark contrast to the company's full-year performance, which saw revenues decline 19.0% year-on-year to ₹25.00 crores in FY25, raising questions about sustainability. The micro-cap stock, currently trading at ₹124.00 with a market capitalisation of ₹36.00 crores, has delivered a disappointing -31.87% return over the past year, significantly underperforming both the broader market and its specialty chemicals peer group.
Read full news article Announcements
Disclosure under Regulation 30A of LODR
01-Jun-2026 | Source : BSEDear Sir Please find attached Newspaper Cutting For Audited Financial Results for the year ended 31st March2026
Corporate Action-Board to consider Dividend
01-Jun-2026 | Source : BSEThe Board Considered 15% dividend on its Board Meeting held on 29th May2026. Nitin S.Shah
Board Meeting Outcome for Board Has Considered And Adopted Audited Standalone And Consolidated Financial Results For The Quarter And Year Ended On 31St March2026
29-May-2026 | Source : BSEBoard has considered and adopted Audited Standalone and Consolidated Financial Results for the quarter and year ended on 31st March2026 and Recommended 15% dividend for the financial year 2025-26
Corporate Actions

No Upcoming Board Meetings

Crestchem Ltd has declared 10% dividend, ex-date: 13 Aug 25

No Splits history available

No Bonus history available

No Rights history available
Quality key factors
Valuation key factors
Technicals key factors
 Technical Indicator Scale: Bearish, Mildly Bearish, Sideways, Mildly Bullish, Bullish Turned
 Shareholding Snapshot : Dec 2025
Shareholding Compare (%holding)
Non Institution
None
Held by 0 Schemes
Held by 0 FIIs
Mr. Dipak Narendraprasad Patel (29.2%)
None
65.99%
Quarterly Results Snapshot (Standalone) - Mar'26 - QoQ

QoQ Growth in quarter ended Mar 2026 is 42.88% vs -0.42% in Dec 2025
QoQ Growth in quarter ended Mar 2026 is 52.78% vs 33.33% in Dec 2025
Half Yearly Results Snapshot (Standalone) - Sep'25

Growth in half year ended Sep 2025 is -6.36% vs 57.80% in Sep 2024
Growth in half year ended Sep 2025 is -44.03% vs 178.95% in Sep 2024
Nine Monthly Results Snapshot (Standalone) - Dec'25
YoY Growth in nine months ended Dec 2025 is 8.57% vs 14.20% in Dec 2024
YoY Growth in nine months ended Dec 2025 is -23.70% vs 42.57% in Dec 2024
Annual Results Snapshot (Standalone) - Mar'26
YoY Growth in year ended Mar 2026 is 18.06% vs 17.97% in Mar 2025
YoY Growth in year ended Mar 2026 is -0.73% vs 26.98% in Mar 2025
About Crestchem Ltd

Company Coordinates


