
Key Events This Week
11 June: Mojo Grade downgraded to Sell amid valuation and financial concerns
12 June: Valuation shift signals expensive terrain despite stellar returns
Week Close: Stock steady at ₹48.28, Sensex up 0.57%
Jun 24, 03:30 PM
BSE+NSE Vol: 100
Iron & Steel Products
INR 21 Cr (Micro Cap)
153.00
NA
0.00%
4.34
1.96%
3.82
Crimson Metal for the last several years.

11 June: Mojo Grade downgraded to Sell amid valuation and financial concerns
12 June: Valuation shift signals expensive terrain despite stellar returns
Week Close: Stock steady at ₹48.28, Sensex up 0.57%

Crimson Metal Engineering Company Ltd, a micro-cap player in the Iron & Steel Products sector, has been assigned a Sell rating with a Mojo Score of 38.0, reflecting concerns across valuation, financial trends, and quality parameters despite a recent mild improvement in technical indicators. The downgrade from a previously ungraded status highlights the challenges the company faces amid flat financial performance and stretched valuation metrics.
Read full news article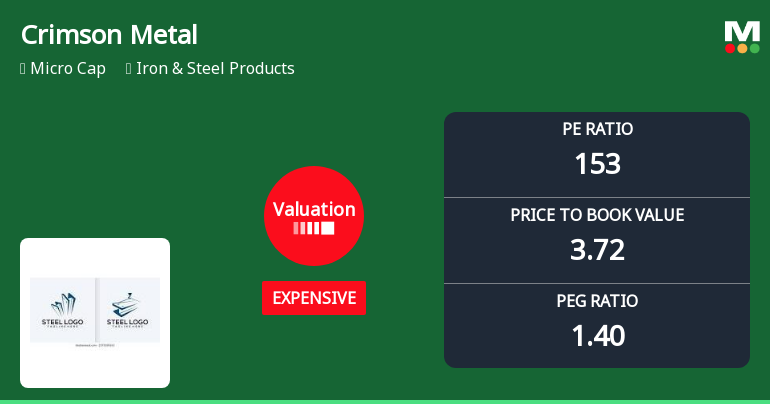
Crimson Metal Engineering Company Ltd, a micro-cap player in the Iron & Steel Products sector, has seen a marked shift in its valuation parameters, moving from a previously risky valuation to an expensive one. With a price-to-earnings (P/E) ratio soaring to 152.71 and a price-to-book value (P/BV) of 3.72, investors are now faced with a stock that demands a premium relative to its historical and peer averages, raising questions about its price attractiveness amid mixed financial metrics and sector dynamics.
Read full news articlePursuant to Regulation 30 of SEBI(LODR) Regulations 2015 & SEBI circular No. HO/38/13/11(2)2026-MIRSD-POD/I/3750/2026 dated January 30 2026 we are enclosing herewith the copies of Newspaper Advertisements published today i.e. Tuesday June 16 2026 in the Trinity Mirror (English Language Daily Newspaper) and Makkal Kural (Chennai Language Daily Newspaper) intimating that the special window has been reopened for Re-lodgement of Transfer and Dematerialisation of Physical shares.
Pursuant to Regulation 47 of the SEBI (LODR) Regulations 2015 we would like to inform you that the Audited Financial Results for the quarter and financial year ended March 31 2026 as approved by the Board of Directors at the Board Meeting held on May 28 2026 were published in the following newspapers.
Considered and approved the Resignation of Mr. Chandrakesh Pal (DIN: 07277936 & PAN: BCCPC1356E) from the post of the Chief Financial Officer (CFO) and Whole Time Director (WTD) of the Company.

No Upcoming Board Meetings

No Dividend history available

No Splits history available

No Bonus history available

No Rights history available
 Technical Indicator Scale: Bearish, Mildly Bearish, Sideways, Mildly Bullish, Bullish Turned
 Non Institution
None
Held by 0 Schemes
Held by 0 FIIs
Premchand Goyal (10.15%)
Janarthanan (31.45%)
15.63%

QoQ Growth in quarter ended Mar 2026 is 1.62% vs -14.75% in Dec 2025

QoQ Growth in quarter ended Mar 2026 is -25.00% vs -20.00% in Dec 2025
Growth in half year ended Sep 2025 is -10.66% vs 14.39% in Sep 2024
Growth in half year ended Sep 2025 is -22.22% vs 800.00% in Sep 2024
YoY Growth in nine months ended Dec 2025 is -9.85% vs 9.66% in Dec 2024
YoY Growth in nine months ended Dec 2025 is -21.43% vs 100.00% in Dec 2024
YoY Growth in year ended Mar 2026 is -17.24% vs 15.58% in Mar 2025
YoY Growth in year ended Mar 2026 is 7.69% vs 109.77% in Mar 2025


