
Compare Crizac with Similar Stocks
Dashboard
High Management Efficiency with a high ROE of 47.99%
The company is Net-Debt Free
Healthy long term growth as Net Sales has grown by an annual rate of 79.50% and Operating profit at 38.21%
With a growth in Net Sales of 9.93%, the company declared Very Positive results in Mar 26
With ROE of 37.5, it has a Expensive valuation with a 5.7 Price to Book Value
Falling Participation by Institutional Investors
Stock DNA
Miscellaneous
INR 3,322 Cr (Small Cap)
15.00
18
4.16%
-0.28
37.49%
5.76
Total Returns (Price + Dividend) 
Latest dividend: 8.014808720691073 per share ex-dividend date: Feb-04-2026
Risk Adjusted Returns v/s
Returns Beta

News
When is the next results date for Crizac Ltd?
The next results date for Crizac Ltd is scheduled for August 3, 2026....
Read full news article
Crizac Ltd is Rated Hold by MarketsMOJO
Crizac Ltd is rated 'Hold' by MarketsMOJO, with this rating last updated on 25 May 2026. While the rating change occurred on that date, the analysis and financial metrics discussed here reflect the stock's current position as of 29 July 2026, providing investors with an up-to-date view of the company’s fundamentals, returns, and market standing.
Read full news article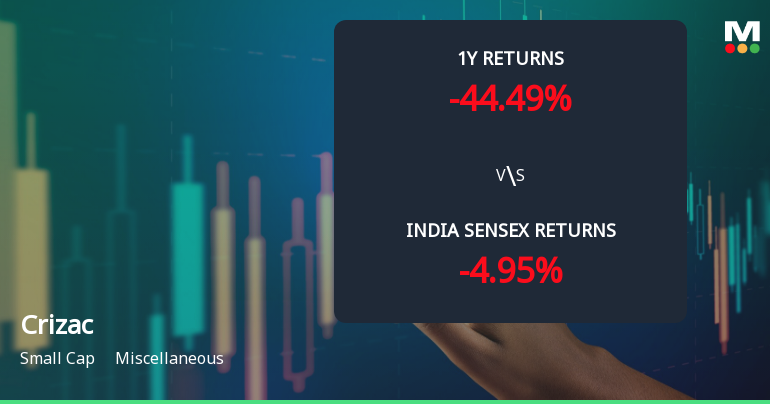
Crizac Ltd Technical Momentum Shifts Amid Bearish Trends and Hold Rating
Crizac Ltd, a small-cap player in the miscellaneous sector, has experienced a notable shift in its technical momentum, moving from a mildly bearish stance to a more pronounced bearish trend. Despite a marginal uptick in its daily price, the stock’s broader technical indicators and price performance relative to the Sensex reveal underlying challenges for investors navigating this evolving landscape.
Read full news article Announcements
Announcement under Regulation 30 (LODR)-Analyst / Investor Meet - Intimation
29-Jul-2026 | Source : BSECrizac Limited has informed the Exchange about the Schedule of the meet of the investors and analysts to be held on Tuesday 04th August 2026 at 4:00 PM IST
Board Meeting Intimation for Intimation Of Board Meeting To Be Held On Monday August 3 2026
29-Jul-2026 | Source : BSECrizac Ltdhas informed BSE that the meeting of the Board of Directors of the Company is scheduled on 03/08/2026 inter alia to consider and approve Crizac Limited has informed to the exchanges regarding the Meeting of the Board of Directors of the Company is scheduled to be held on 03/08/2026 inter alia to consider and approve the un-audited Financial Results of the Company along with Limited Review Report for the quarter ended June 30 2026.
Announcement under Regulation 30 (LODR)-Press Release / Media Release
28-Jul-2026 | Source : BSEPlease find attached a copy of Press Release being issued by the Company titles Crizac Strengthens its position in Mexico and Expands into the Netherlands with Acquisition of Inova Education
Corporate Actions

03 Aug 2026

Crizac Ltd has declared 400% dividend, ex-date: 04 Feb 26

No Splits history available

No Bonus history available

No Rights history available
Quality key factors
Valuation key factors
Technicals key factors
 Technical Indicator Scale: Bearish, Mildly Bearish, Sideways, Mildly Bullish, Bullish Turned
 Shareholding Snapshot : Jun 2026
Shareholding Compare (%holding)
Promoters
None
Held by 6 Schemes (0.41%)
Held by 18 FIIs (1.61%)
Pinky Agarwal (30.06%)
Carnelian Bharat Amritkaal Fund . (1.49%)
10.41%
Quarterly Results Snapshot (Standalone) - Mar'26 - QoQ

QoQ Growth in quarter ended Mar 2026 is 9.93% vs -10.58% in Dec 2025

QoQ Growth in quarter ended Mar 2026 is -10.89% vs -8.03% in Dec 2025
Half Yearly Results Snapshot (Consolidated) - Sep'25
Growth in half year ended Sep 2025 is 27.66% vs 10.78% in Sep 2024
Growth in half year ended Sep 2025 is 52.44% vs -31.08% in Sep 2024
Nine Monthly Results Snapshot (Consolidated) - Dec'25
YoY Growth in nine months ended Dec 2025 is 27.81% vs -22.26% in Dec 2024
YoY Growth in nine months ended Dec 2025 is 37.16% vs -36.20% in Dec 2024
Annual Results Snapshot (Consolidated) - Mar'26
YoY Growth in year ended Mar 2026 is 22.68% vs 79.61% in Mar 2025
YoY Growth in year ended Mar 2026 is 41.39% vs 38.21% in Mar 2025
About Crizac Ltd

Company Coordinates


