
Compare Crompton Gr. Con with Similar Stocks
Dashboard
High Management Efficiency with a high ROCE of 25.96%
Company has a Debt to Equity ratio (avg) of 0.04 times
Poor long term growth as Operating profit has grown by an annual rate -1.38% of over the last 5 years
Positive results in Mar 26
With ROE of 17, it has a Attractive valuation with a 5.6 Price to Book Value
High Institutional Holdings at 86.63%
Underperformed the market in the last 1 year
Stock DNA
Electronics & Appliances
INR 16,533 Cr (Small Cap)
33.00
52
1.18%
-0.32
16.98%
5.50
Total Returns (Price + Dividend) 
Latest dividend: 3 per share ex-dividend date: Jul-24-2025
Risk Adjusted Returns v/s
Returns Beta

News

Crompton Greaves Consumer Electricals Ltd is Rated Hold
Crompton Greaves Consumer Electricals Ltd is rated 'Hold' by MarketsMOJO, with this rating last updated on 13 May 2026. However, the analysis and financial metrics discussed below reflect the stock's current position as of 12 June 2026, providing investors with an up-to-date perspective on the company’s fundamentals, valuation, financial trends, and technical outlook.
Read full news article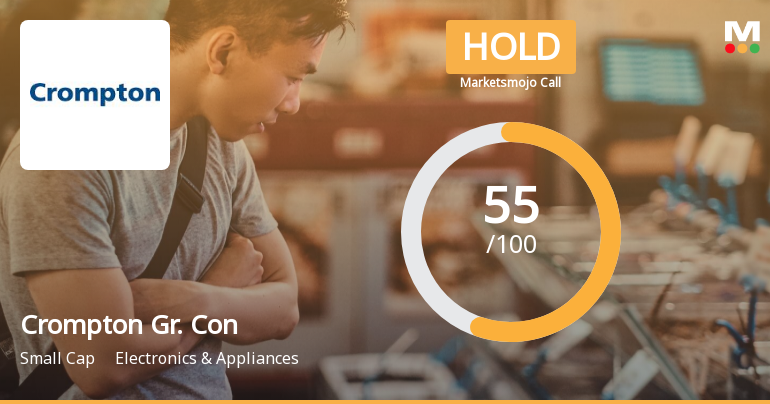
Crompton Greaves Consumer Electricals Ltd is Rated Hold
Crompton Greaves Consumer Electricals Ltd is rated 'Hold' by MarketsMOJO, with this rating last updated on 13 May 2026. While the rating change occurred on that date, the analysis and financial metrics presented here reflect the stock's current position as of 01 June 2026, providing investors with the most up-to-date view of the company’s fundamentals and market performance.
Read full news article
Crompton Greaves Consumer Electricals Sees Sharp Open Interest Surge Amid Mixed Market Signals
Crompton Greaves Consumer Electricals Ltd has witnessed a notable 13.03% surge in open interest in its derivatives segment, signalling heightened market activity and shifting investor positioning. Despite underperforming its sector on 22 May 2026, the stock’s rising open interest and volume patterns suggest evolving directional bets that merit close attention from traders and investors alike.
Read full news article Announcements
Announcement under Regulation 30 (LODR)-Analyst / Investor Meet - Intimation
10-Jun-2026 | Source : BSEDisclosure under Regulation 30 of the SEBI (Listing Obligations and Disclosure Requirements) Regulations 2015 - Schedule of Analyst/ Institutional Investor Meeting
Announcement under Regulation 30 (LODR)-Analyst / Investor Meet - Intimation
08-Jun-2026 | Source : BSEIntimation of Schedule of Analyst / Institutional Investor Meeting
Announcement under Regulation 30 (LODR)-Analyst / Investor Meet - Intimation
08-Jun-2026 | Source : BSEIntimation of schedule of analyst / institutional investor meeting.
Corporate Actions

No Upcoming Board Meetings

Crompton Greaves Consumer Electricals Ltd has declared 150% dividend, ex-date: 24 Jul 26

No Splits history available

No Bonus history available

No Rights history available
Quality key factors
Valuation key factors
Technicals key factors
 Technical Indicator Scale: Bearish, Mildly Bearish, Sideways, Mildly Bullish, Bullish Turned
 Shareholding Snapshot : Mar 2026
Shareholding Compare (%holding)
Mutual Funds
None
Held by 38 Schemes (54.49%)
Held by 211 FIIs (20.49%)
None
Hdfc Mutual Fund - Hdfc Business Cycle Fund (9.82%)
11.2%
Quarterly Results Snapshot (Consolidated) - Mar'26 - QoQ

QoQ Growth in quarter ended Mar 2026 is 20.28% vs -0.90% in Dec 2025

QoQ Growth in quarter ended Mar 2026 is -643.11% vs 38.13% in Dec 2025
Half Yearly Results Snapshot (Consolidated) - Sep'25
Growth in half year ended Sep 2025 is -2.97% vs 10.24% in Sep 2024
Growth in half year ended Sep 2025 is -30.06% vs 28.32% in Sep 2024
Nine Monthly Results Snapshot (Consolidated) - Dec'25
YoY Growth in nine months ended Dec 2025 is 0.16% vs 8.43% in Dec 2024
YoY Growth in nine months ended Dec 2025 is -24.50% vs 28.15% in Dec 2024
Annual Results Snapshot (Consolidated) - Mar'26
YoY Growth in year ended Mar 2026 is 2.94% vs 7.54% in Mar 2025
YoY Growth in year ended Mar 2026 is -143.56% vs 26.38% in Mar 2025
About Crompton Greaves Consumer Electricals Ltd

Company Coordinates


