
Compare Cropster Agro with Similar Stocks
Total Returns (Price + Dividend) 
Cropster Agro for the last several years.
Risk Adjusted Returns v/s
Returns Beta

News

Cropster Agro Ltd is Rated Sell
Cropster Agro Ltd is rated Sell by MarketsMOJO, with this rating last updated on 12 Dec 2025. However, the analysis and financial metrics discussed here reflect the stock’s current position as of 10 June 2026, providing investors with an up-to-date view of the company’s performance and outlook.
Read full news articleAre Cropster Agro Ltd latest results good or bad?
The latest financial results for Cropster Agro Ltd reveal significant operational challenges, particularly highlighted by a dramatic decline in revenue. In the quarter ending March 2026, the company reported net sales of ₹17.68 crores, which represents a substantial 68.25% decrease year-on-year and a 67.30% decline sequentially. This marks the lowest quarterly revenue recorded in recent periods, raising concerns about the company's operational continuity and the sustainability of its business model. Despite the severe revenue drop, Cropster Agro managed to maintain its operating margin at 8.71%, which reflects a slight improvement from the previous quarter and the same quarter last year. However, the operating profit (PBDIT) fell to ₹1.54 crores, down 57.92% compared to the prior year, indicating that while cost controls may have been effective, they were insufficient to offset the revenue collapse. Net p...
Read full news article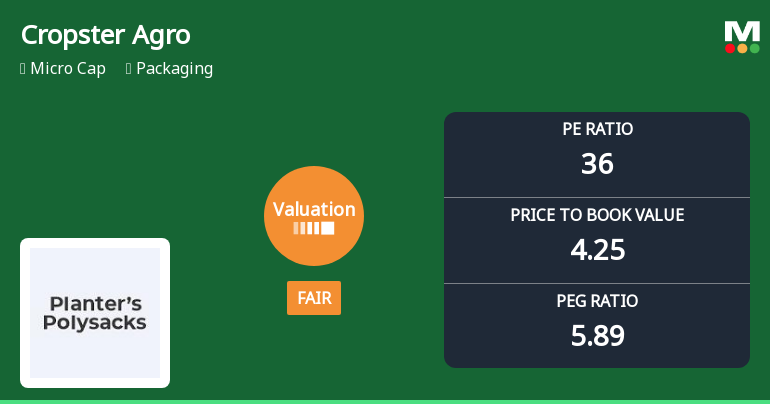
Cropster Agro Ltd Valuation Shifts to Fair Amidst Market Challenges
Cropster Agro Ltd, a micro-cap player in the packaging sector, has recently undergone a notable shift in its valuation parameters, moving from an expensive to a fair valuation grade. Despite this adjustment, the company’s price-to-earnings (P/E) and price-to-book value (P/BV) ratios remain elevated compared to many peers, reflecting ongoing investor caution amid subdued price performance and mixed fundamentals.
Read full news article Announcements
Non-Applicability Of Large Corporate Clause
09-Jun-2026 | Source : BSENon-Applicability of Large Corporate Clause
Submission Of Revised Audited Financial Results For The Quarter And Year Ended On 31St March 2026
05-Jun-2026 | Source : BSESubmission of Revised Audited Financial Results for the Quarter and Year Ended on 31st March 2026
Submission Of Revised Integrated Filing (Finance) For The Quarter And Year Ended On 31St March 2026
05-Jun-2026 | Source : BSESubmission of Revised Integrated Filing (Finance) for the Quarter and Year Ended on 31st March 2026
Corporate Actions

No Upcoming Board Meetings

No Dividend history available

Cropster Agro Ltd has announced 1:10 stock split, ex-date: 08 Nov 24

Cropster Agro Ltd has announced 2:1 bonus issue, ex-date: 08 Nov 24

No Rights history available
Quality key factors
Valuation key factors
Technicals key factors
 Technical Indicator Scale: Bearish, Mildly Bearish, Sideways, Mildly Bullish, Bullish Turned
 Shareholding Snapshot : Mar 2026
Shareholding Compare (%holding)
Non Institution
None
Held by 0 Schemes
Held by 0 FIIs
None
Nilratan Suppliers Private Limited (5.79%)
67.7%
Quarterly Results Snapshot (Standalone) - Mar'26 - YoY

YoY Growth in quarter ended Mar 2026 is -68.25% vs 102.88% in Mar 2025
YoY Growth in quarter ended Mar 2026 is -54.49% vs -37.52% in Mar 2025
Half Yearly Results Snapshot (Standalone) - Sep'25
Growth in half year ended Sep 2025 is 17.60% vs 462.36% in Sep 2024
Growth in half year ended Sep 2025 is 34.83% vs 710.81% in Sep 2024
Nine Monthly Results Snapshot (Standalone) - Dec'25
YoY Growth in nine months ended Dec 2025 is 13.67% vs 316.75% in Dec 2024
YoY Growth in nine months ended Dec 2025 is 30.71% vs 74.91% in Dec 2024
Annual Results Snapshot (Standalone) - Mar'26
YoY Growth in year ended Mar 2026 is -9.81% vs 220.05% in Mar 2025
YoY Growth in year ended Mar 2026 is 6.08% vs 17.24% in Mar 2025
About Cropster Agro Ltd

Company Coordinates


