
Compare Crystal Business with Similar Stocks
Dashboard
Weak Long Term Fundamental Strength with a -17.33% CAGR growth in Net Sales over the last 5 years
- Company's ability to service its debt is weak with a poor EBIT to Interest (avg) ratio of -0.09
- The company has been able to generate a Return on Equity (avg) of 3.72% signifying low profitability per unit of shareholders funds
With ROE of 1, it has a Expensive valuation with a 1.5 Price to Book Value
Consistent Underperformance against the benchmark over the last 3 years
Stock DNA
Media & Entertainment
INR 21 Cr (Micro Cap)
150.00
21
0.00%
0.00
1.01%
1.51
Total Returns (Price + Dividend) 
Latest dividend: 0 per share ex-dividend date: Sep-17-2020
Risk Adjusted Returns v/s
Returns Beta

News

Crystal Business System Ltd Upgraded to Hold on Technical and Financial Improvements
Crystal Business System Ltd has seen its investment rating upgraded from Sell to Hold as of 2 June 2026, driven primarily by a marked improvement in technical indicators and a return to positive quarterly financial performance. Despite lingering concerns over long-term fundamentals and valuation metrics, the stock’s recent momentum and quarterly earnings rebound have prompted a reassessment of its outlook within the Media & Entertainment sector.
Read full news article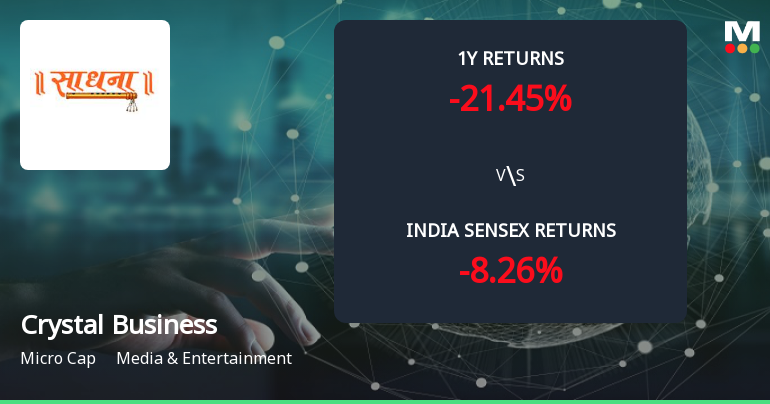
Golden Cross Confirmed: Do Crystal Business System Ltd's Other Technical Indicators Agree?
The 50-day moving average has crossed above the 200-day moving average for Crystal Business System Ltd, signalling a golden cross on 2 Jun 2026. Yet, the stock fell 1.82% on the day this crossover occurred, and the monthly technical indicators present a mixed picture. This divergence between the moving averages and price action calls for a detailed examination of the signal's reliability.
Read full news article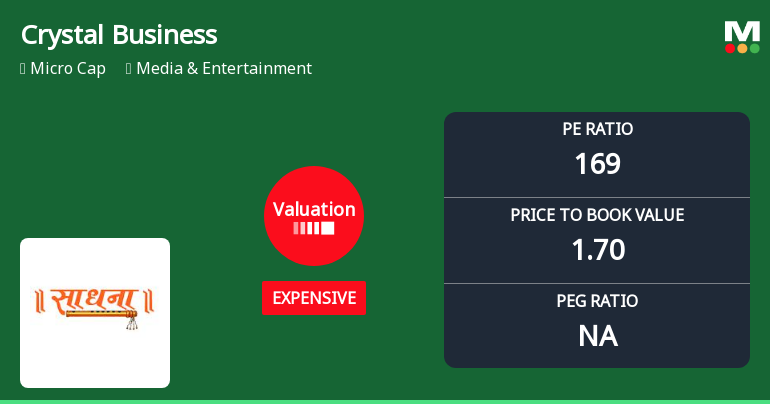
Crystal Business System Ltd Valuation Shifts Signal Price Attractiveness Challenges
Crystal Business System Ltd, a micro-cap player in the Media & Entertainment sector, has seen a notable shift in its valuation parameters, moving from a risky to an expensive rating. This change, coupled with a recent downgrade in its Mojo Grade to Sell, raises questions about the stock’s price attractiveness amid challenging fundamentals and peer comparisons.
Read full news article Announcements
Appointment of Company Secretary and Compliance Officer
08-Jun-2026 | Source : BSEWe hereby inform that the Board of directors of Company in its meeting held on Monday 08-06-2026 has approved the appointment of Ms. Khushi Jain a Qualified Company Secretary (Mem. No. A79892) as the Company Secretary and Compliance Officer of the company with effect from 08/06/2026.
Announcement under Regulation 30 (LODR)-Newspaper Publication
17-May-2026 | Source : BSEWe hereby submitting the Newspaper Publication of quarter ended 31st March 2026
Submission Of Audited Financial Results Of The Company For The Quarter And Year Ended 31St March 2026 Pursuant To Regulation 33 Of The SEBI (Listing Obligations And Disclosure Requirements) 2015.
16-May-2026 | Source : BSEThis is with reference to our earlier annoucement dated 15th May 2026 We hereby Submitting the financial Results of Quarter Ended 31st March 2026.
Corporate Actions

No Upcoming Board Meetings


Crystal Business System Ltd has announced 1:10 stock split, ex-date: 10 Jun 22

No Bonus history available

No Rights history available
Quality key factors
Valuation key factors
Technicals key factors
 Technical Indicator Scale: Bearish, Mildly Bearish, Sideways, Mildly Bullish, Bullish Turned
 Shareholding Snapshot : Mar 2026
Shareholding Compare (%holding)
Non Institution
None
Held by 0 Schemes
Held by 0 FIIs
Sadhna Media Private Limited (8.64%)
Sharpline Broadcast Limited (9.34%)
62.04%
Quarterly Results Snapshot (Standalone) - Mar'26 - YoY

YoY Growth in quarter ended Mar 2026 is -28.79% vs 66.49% in Mar 2025

YoY Growth in quarter ended Mar 2026 is 351.18% vs -225.74% in Mar 2025
Half Yearly Results Snapshot (Standalone) - Sep'25
Growth in half year ended Sep 2025 is -53.10% vs -28.48% in Sep 2024
Growth in half year ended Sep 2025 is -268.35% vs -28.83% in Sep 2024
Nine Monthly Results Snapshot (Standalone) - Dec'25
YoY Growth in nine months ended Dec 2025 is -62.08% vs -6.60% in Dec 2024
YoY Growth in nine months ended Dec 2025 is -239.91% vs 420.59% in Dec 2024
Annual Results Snapshot (Standalone) - Mar'26
YoY Growth in year ended Mar 2026 is -49.59% vs 11.75% in Mar 2025
YoY Growth in year ended Mar 2026 is -86.81% vs 167.65% in Mar 2025
About Crystal Business System Ltd

Company Coordinates


