CSL Finance

  • Market Cap: Micro Cap
  • Industry: Non Banking Financial Company (NBFC)
  • ISIN: INE718F01018
  • NSEID: CSLFINANCE
  • BSEID: 530067
INR
288.55
-0.2 (-0.07%)
BSENSE

Dec 04

BSE+NSE Vol: 389

  • Price Points
  • Score
  • Mojo Parameters
  • Total Return
  • News and Corporate Actions
  • Key factors
  • Shareholding
  • Financials
  • CompanyCV
stock-summaryPrice Point
High/Low

1Day

52 Week

Valuation
Technical
Day's Volume

CASH

389 (-97.57%) Volume

Shareholding (Sep 2025)

FII

0.77%

Held by 4 FIIs

DII

0.96%

Held by 0 DIIs

Promoter

47.56%

Who are the top shareholders of the CSL Finance?

06-Jun-2025

The top shareholders of CSL Finance are Csl Capital Private Limited with 29.19%, individual investors with 27.41%, and Aadi Financial Advisors LLP as the largest public shareholder at 3.38%. There are also 8 foreign institutional investors holding a combined 0.83%, with no pledged promoter holdings or mutual fund schemes.

The top shareholders of CSL Finance include Csl Capital Private Limited, which holds the largest stake at 29.19%. Following that, individual investors collectively own 27.41% of the company. Additionally, Aadi Financial Advisors LLP is the highest public shareholder with a holding of 3.38%. The company also has 8 foreign institutional investors (FIIs) with a combined holding of 0.83%. There are no pledged promoter holdings or mutual fund schemes involved.

Read More

What does CSL Finance do?

06-Jun-2025

CSL Finance Ltd is a micro-cap NBFC that provides financial services to small and medium-sized businesses. As of March 2025, it reported net sales of ₹57 Cr and a net profit of ₹19 Cr, with a market cap of ₹788 Cr.

Overview:<BR>CSL Finance Ltd is a micro-cap company operating in the Non-Banking Financial Company (NBFC) sector, providing financial facilities to small and medium-sized business units.<BR><BR>History:<BR>Incorporated on December 28, 1992, CSL Finance Ltd was formerly known as Consolidated Securities Limited. The latest quarterly results reported net sales and net profit for the period ending March 2025.<BR><BR>Financial Snapshot:<BR>Net Sales: 57 Cr (Quarterly Results - Mar 2025) <BR>Net Profit: 19 Cr (Quarterly Results - Mar 2025) <BR>Market Cap: Rs 788 Cr (Micro Cap)<BR><BR>Key Metrics:<BR>P/E: 10.00 <BR>Industry P/E: 23 <BR>Dividend Yield: 0.00% <BR>Debt-Equity: 1.29 <BR>Return on Equity: 13.31% <BR>Price to Book: 1.40 <BR><BR>Contact Details:<BR>Address: 410-412 18/12 4th Floor W.E.A, Arya Samaj Road Karol Bagh New Delhi New Delhi : 110005 <BR>Tel: 91-11-42503441-44 <BR>Email: info@consec.in <BR>Website: http://www.cslfinance.in

Read More

When is the next results date for CSL Finance?

06-Jun-2025

No Upcoming Board Meetings

What is the bonus history of the CSL Finance?

06-Jun-2025

CSL Finance announced a 2:1 bonus issue on August 9, 2021, with a record date of August 10, 2021, meaning shareholders received two shares for every one share held.

CSL Finance has a bonus history that includes a notable event on August 9, 2021, when the company announced a 2:1 bonus issue. The record date for this bonus was August 10, 2021. This means that shareholders received two shares for every one share they held as of the record date. If you have any more questions about CSL Finance or its financial activities, feel free to ask!

Read More

Has CSL Finance declared dividend?

06-Jun-2025

CSL Finance Ltd has declared a 25% dividend, amounting to 2.5 per share, with an ex-date of September 15, 2023. While the company has shown significant long-term growth, recent total returns have varied, including a -17.48% return over the past year.

CSL Finance Ltd has declared a 25% dividend.<BR><BR>Dividend Details:<BR>- Percentage announced: 25%<BR>- Amount per share: 2.5<BR>- Ex-date: 15 Sep 23<BR><BR>Dividend Yield: 0%<BR><BR>Total Returns by Period:<BR>In the last 6 months, the price return was 4.37%, the dividend return was 0%, resulting in a total return of 4.37%.<BR><BR>Over the past year, the price return was -17.48%, with a dividend return of 0%, leading to a total return of -17.48%.<BR><BR>In the last 2 years, the price return was 46.55%, the dividend return was 0.92%, culminating in a total return of 47.47%.<BR><BR>For the 3-year period, the price return was 63.25%, the dividend return was 2.59%, which resulted in a total return of 65.84%.<BR><BR>In the last 4 years, the price return was 317.81%, the dividend return was 6.81%, giving a total return of 324.62%.<BR><BR>Over the past 5 years, the price return was 451.83%, with a dividend return of 17.20%, leading to a total return of 469.03%.<BR><BR>Overall, CSL Finance has declared a dividend while experiencing varying total returns across different periods, with significant growth in the long term despite some negative returns in the short term.

Read More

Who are the peers of the CSL Finance?

03-Jun-2025

CSL Finance's peers include Bajaj Finance, Jio Financial, Cholaman.Inv.&Fn, Shriram Finance, Muthoot Finance, Yogi Ltd, Manba Finance, Kiran Vyapar, and Aryaman Fin.Serv. In terms of performance, Yogi Ltd leads with a 1-year return of 243.14%, while CSL Finance has a return of -17.26%.

Peers: The peers of CSL Finance are Bajaj Finance, Jio Financial, Cholaman.Inv.&Fn, Shriram Finance, Muthoot Finance, Yogi Ltd, Manba Finance, Kiran Vyapar, and Aryaman Fin.Serv.<BR><BR>Quality Snapshot: Excellent management risk is observed at Bajaj Finance, Cholaman.Inv.&Fn, Muthoot Finance, and Yogi Ltd, while Average management risk is found at Jio Financial, CSL Finance, Manba Finance, Aryaman Fin.Serv, and the rest. Good growth is noted at Bajaj Finance, Cholaman.Inv.&Fn, Shriram Finance, and CSL Finance, while Excellent growth is seen at Jio Financial, Yogi Ltd, Manba Finance, and the rest. Excellent capital structure is present at Bajaj Finance, Jio Financial, Shriram Finance, Muthoot Finance, Yogi Ltd, Manba Finance, Kiran Vyapar, Aryaman Fin.Serv, and the rest, while Good capital structure is found at Cholaman.Inv.&Fn.<BR><BR>Return Snapshot: Yogi Ltd has the highest 1-year return at 243.14%, while Jio Financial has the lowest at -20.23%. CSL Finance's 1-year return is -17.26%, which is higher than Jio Financial's but lower than Yogi Ltd's. Additionally, Jio Financial and Manba Finance are among the peers with negative six-month returns.

Read More

Who are in the management team of CSL Finance?

16-Jul-2025

As of March 2019, the management team of CSL Finance includes Rohit Gupta (Managing Director), Ashok Kumar Kathuria (Director), and several other directors and company secretaries, totaling a diverse leadership group.

As of March 2019, the management team of CSL Finance includes the following individuals:<BR><BR>1. Rohit Gupta - Managing Director<BR>2. Ashok Kumar Kathuria - Director<BR>3. Akash Gupta - Company Secretary<BR>4. Anjna Mittal - Independent Director<BR>5. Manoj Gupta - Independent Director<BR>6. Ayush Mittal - Additional Director<BR>7. Rachita Gupta - Whole-Time Director & Additional Director<BR>8. Anju Biyani - Company Secretary<BR>9. Preeti Gupta - Company Secretary<BR>10. Chandra Subhash Kwatra - Additional Director<BR>11. Parmod Bindal - Additional Director<BR><BR>As of March 2019, the team consists of a mix of directors, company secretaries, and independent directors, with Rohit Gupta serving as the Managing Director.

Read More

How big is CSL Finance?

24-Jul-2025

As of 24th July, CSL Finance Ltd has a market capitalization of 743.00 Cr, with Net Sales of 215.07 Cr and a Net Profit of 72.09 Cr for the latest four quarters. The company has Shareholder's Funds of 474.83 Cr and Total Assets of 984.28 Cr.

As of 24th July, CSL Finance Ltd has a market capitalization of 743.00 Cr, categorizing it as a Micro Cap company.<BR><BR>For the latest four quarters, CSL Finance reported Net Sales of 215.07 Cr and a Net Profit of 72.09 Cr.<BR><BR>As of the latest annual period, the company has Shareholder's Funds amounting to 474.83 Cr and Total Assets of 984.28 Cr.

Read More

Are CSL Finance latest results good or bad?

13-Aug-2025

CSL Finance's latest results show mixed performance; while net sales and operating profit are at their highest in five quarters, concerns arise from declining growth rates and an increased debt-equity ratio, indicating potential challenges ahead.

CSL Finance's latest results present a mixed picture. On one hand, the company has shown some positive trends, such as achieving its highest net sales and operating profit in the last five quarters, with net sales reaching Rs 59.45 crore and an operating profit of Rs 46.13 crore. The operating profit margin is also strong at 77.59%, indicating improved efficiency. Additionally, both profit before tax and profit after tax have reached their highest levels in five quarters, which is a positive sign for profitability.<BR><BR>However, there are concerns as well. The overall performance score has declined from 7 to 5 over the past three months, and year-over-year growth rates for net sales and net profit have decreased compared to the previous year. Furthermore, the debt-equity ratio has risen to 1.29 times, the highest in five half-yearly periods, which suggests increased borrowing and potential liquidity stress.<BR><BR>In summary, while there are some encouraging financial metrics, the overall stagnation and rising debt levels indicate that the results are not entirely positive. The company is experiencing both growth in certain areas and challenges that need to be addressed.

Read More

Is CSL Finance overvalued or undervalued?

24-Oct-2025

As of October 23, 2025, CSL Finance is undervalued with a PE ratio of 8.65 and strong fundamentals, making it a compelling investment opportunity despite a recent stock decline of 20.45%.

As of 23 October 2025, CSL Finance has moved from an attractive to a very attractive valuation grade. The company is currently undervalued, with a PE ratio of 8.65, an EV to EBIT of 7.54, and a PEG ratio of 0.94, indicating strong earnings potential relative to its price. In comparison to its peers, Bajaj Finance is deemed very expensive with a PE ratio of 39.07, while Life Insurance, classified as very attractive, has a PE ratio of 11.68, further supporting CSL Finance's undervaluation.<BR><BR>Despite recent stock performance showing a decline of 20.45% over the past year compared to a 5.59% increase in the Sensex, the company's solid fundamentals, including a ROCE of 13.89% and a ROE of 13.83%, suggest that it is well-positioned for future growth. Given these factors, CSL Finance presents a compelling investment opportunity in the current market landscape.

Read More

How has been the historical performance of CSL Finance?

13-Nov-2025

CSL Finance has experienced significant growth from March 2020 to March 2025, with net sales increasing from 60.86 Cr to 215.06 Cr and profit before tax rising from 31.74 Cr to 96.88 Cr. However, the company faces challenges with rising interest expenses and negative cash flow from operating activities.

Answer:<BR>CSL Finance has shown significant growth in its historical performance, particularly in net sales and profit metrics over the past several years. <BR><BR>Breakdown:<BR>From March 2020 to March 2025, net sales increased from 60.86 Cr to 215.06 Cr, reflecting a strong upward trend. Total operating income followed a similar trajectory, rising from 60.86 Cr in March 2020 to 215.06 Cr in March 2025. Operating profit (PBDIT) also saw substantial growth, climbing from 32.49 Cr in March 2020 to 98.60 Cr in March 2025. However, interest expenses increased significantly during this period, from 10.61 Cr to 64.91 Cr, impacting the gross profit before tax, which was 33.69 Cr in March 2025 compared to 21.88 Cr in March 2020. Profit before tax rose from 31.74 Cr in March 2020 to 96.88 Cr in March 2025, while profit after tax increased from 22.47 Cr to 72.09 Cr over the same period. The company’s total assets grew from 331.35 Cr in March 2020 to 1,243.96 Cr in March 2025, with total liabilities also rising from 331.35 Cr to 694.94 Cr. Cash flow from operating activities remained negative, indicating challenges in cash generation despite the growth in profits, with a cash flow of -172.00 Cr in March 2025. Overall, CSL Finance has demonstrated robust revenue growth and profitability, although it faces rising interest costs and cash flow challenges.

Read More

Should I buy, sell or hold CSL Finance?

15-Nov-2025

Is CSL Finance technically bullish or bearish?

27-Nov-2025

As of November 26, 2025, the market trend is mildly bearish, indicated by daily moving averages and weekly KST, despite mixed signals from the MACD and Dow Theory suggesting a lack of strong bullish momentum.

As of 26 November 2025, the technical trend has changed from bearish to mildly bearish. The current stance is mildly bearish, driven by the daily moving averages indicating a bearish trend and the weekly KST also showing bearish momentum. The MACD is mildly bullish on the weekly timeframe, but bearish on the monthly, creating a mixed signal. The Bollinger Bands and OBV both reflect a mildly bearish outlook on both weekly and monthly timeframes. Dow Theory supports a mildly bullish view on the weekly but remains bearish on the monthly. Overall, the indicators suggest a lack of strong bullish momentum, reinforcing the mildly bearish stance.

Read More

Why is CSL Finance falling/rising?

04-Dec-2025

As of 04-Dec, CSL Finance Ltd's stock price is rising to 288.55, reflecting a 0.66% increase. While the stock has shown positive short-term performance, there are concerns about declining investor participation and longer-term losses.

As of 04-Dec, CSL Finance Ltd's stock price is rising, currently at 288.55, reflecting an increase of 1.9 (0.66%). This upward movement is supported by the stock's performance today, where it outperformed the sector by 0.54%. Additionally, the stock reached an intraday high of Rs 293, marking a rise of 2.22%. <BR><BR>In the context of recent performance, the stock has shown a positive trend over the past week, gaining 0.66%, while the benchmark Sensex has declined by 0.53%. Over the past month, CSL Finance has increased by 8.29%, significantly outperforming the Sensex, which rose by only 2.16%. However, it is important to note that the stock has experienced declines year-to-date and over the past year, with losses of 8.99% and 12.56%, respectively.<BR><BR>Despite the current rise, there are indications of falling investor participation, as evidenced by a 30.72% decrease in delivery volume compared to the 5-day average. This could suggest that while the stock is currently rising, there may be underlying concerns regarding sustained interest from investors. Overall, the recent price increase can be attributed to short-term positive performance metrics, despite longer-term challenges.

Read More
iScoreScore
Click here to find our call on this stock
Strong Sell
Sell
Hold
Buy
Strong Buy

MarketsMojo — Loved in India, Now Global

The power of Mojo is now in 29 countries. Explore global equities with the same cutting-edge features you love.

Dashboard
1

Weak Long Term Fundamental Strength with an average Return on Equity (ROE) of 12.48%

 
2

Despite the size of the company, domestic mutual funds hold only 0% of the company

3

Below par performance in long term as well as near term

stock-summaryMojo Parameters
Mojo Parameters
Loading Valuation Snapshot...
Stock DNA
stock-summary
Industry

Non Banking Financial Company (NBFC)

stock-summary
Market cap

INR 657 Cr (Micro Cap)

stock-summary
P/E

8.00

stock-summary
Industry P/E

9

stock-summary
Dividend Yield

1.05%

stock-summary
Debt Equity

1.37

stock-summary
Return on Equity

14.04%

stock-summary
Price to Book

1.12

Revenue and Profits:
Net Sales:
64 Cr
(Quarterly Results - Sep 2025)
Net Profit:
24 Cr
stock-summaryTotal Returns
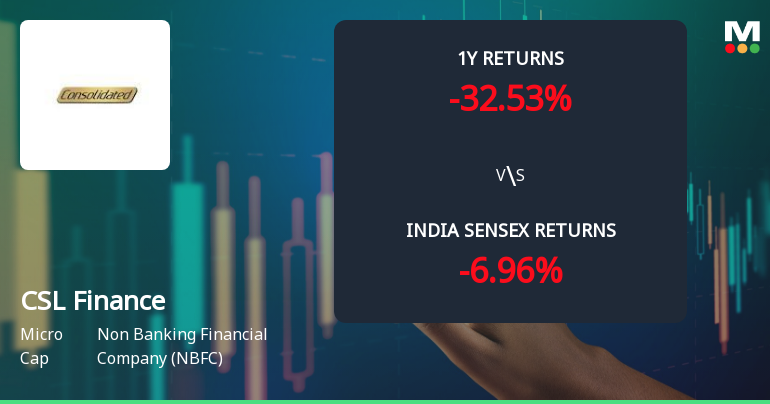
Total Returns (Price + Dividend) stock-summary
Dividend Yield (1.05%)
TimePeriod
Price Return
Dividend Return
Total Return
3 Months
-1.9%
1.03%
-0.87%
6 Months
-13.15%
0.83%
-12.32%
1 Year
-13.11%
0.94%
-12.17%
2 Years
-32.03%
0.62%
-31.41%
3 Years
14.03%
2.40%
16.43%
4 Years
127.29%
6.29%
133.58%
5 Years
214.76%
11.82%
226.58%

Latest dividend: 3 per share ex-dividend date: Sep-12-2025

Risk Adjusted Returns v/s stock-summary
Returns Beta
Icon
Beta has not been calculated since enough price history is not available
stock-summaryNews & Corporate Actions
News

Why is CSL Finance falling/rising?

Recent Price Movement and Market Outperformance

CSL Finance’s share price has demonstrated a strong upward trajectory in recent sessions, rising by 6.07% over the past week compared to a modest 0.65% gain in the Sensex. This outperformance extends to the monthly horizon as well, with the stock appreciating 7.38% against the benchmark’s 1.43% rise. Despite a negative year-to-date return of -6.58%, the stock’s recent momentum suggests a potential shift in investor sentiment. The current price increase of ₹4.50 on 02-Dec further underscores this positive trend, marking the second consecutive day of gains and contributing to a cumulative 3.48% return over this brief period.

Technical Strength and Moving Averages

From a technical perspective, CSL Fin...

Read More
Announcements stock-summary

Announcement under Regulation 30 (LODR)-Newspaper Publication

26-Nov-2025 | Source : BSE

Newspaper Publication regarding final notice to shareholders on special window for Re-Lodgement of transfer requests of physical shares.

Announcement under Regulation 30 (LODR)-Newspaper Publication

17-Nov-2025 | Source : BSE

Copy of newspaper publication

Announcement under Regulation 30 (LODR)-Analyst / Investor Meet - Outcome

17-Nov-2025 | Source : BSE

Transcript of conference call held on November 14 2025

Corporate Actions stock-summary
stock-summary
BOARD MEETING

No Upcoming Board Meetings

stock-summary
DIVIDEND

CSL Finance Ltd has declared 30% dividend, ex-date: 12 Sep 25

stock-summary
SPLITS

No Splits history available

stock-summary
BONUS

CSL Finance Ltd has announced 2:1 bonus issue, ex-date: 09 Aug 21

stock-summary
RIGHTS

No Rights history available

stock-summaryKey Factors
Quality key factors stock-summary
Factor
Value
Sales Growth (5y)
31.08%
EBIT Growth (5y)
34.86%
Net Debt to Equity (avg)
1.37
Institutional Holding
1.73%
ROE (avg)
12.48%
Valuation key factors
Factor
Value
P/E Ratio
8
Industry P/E
9
Price to Book Value
1.13
EV to EBIT
7.70
EV to EBITDA
7.62
EV to Capital Employed
1.06
EV to Sales
5.86
PEG Ratio
0.58
Dividend Yield
1.04%
ROCE (Latest)
13.76%
ROE (Latest)
14.04%
Technicals key factors
Indicator
Weekly
Monthly
MACD
Mildly Bullish
Bearish
RSI
No Signal
No Signal
Bollinger Bands
Mildly Bearish
Mildly Bearish
Moving Averages
Mildly Bearish (Daily)
KST
Mildly Bullish
Bearish
Dow Theory
No Trend
No Trend
OBV
Mildly Bearish
No Trend
stock-summary Technical Indicator Scale: Bearish, Mildly Bearish, Sideways, Mildly Bullish, Bullish  Turned 
stock-summaryShareholding
Shareholding Snapshot : Sep 2025stock-summary
Shareholding Compare (%holding) stock-summary
Majority shareholders

Non Institution

Pledged Promoter Holdings

None

Mutual Funds

Held by 0 Schemes

FIIs

Held by 4 FIIs (0.77%)

Promoter with highest holding

Csl Capital Private Limited (29.19%)

Highest Public shareholder

Aadi Financial Advisors Llp (3.38%)

Individual Investors Holdings

27.76%

stock-summaryFinancial
[
  {
    "link": "quarterly",
    "btn_text": "All Quarterly Results",
    "header": "Quarterly Results Snapshot (Standalone) - Sep'25 - YoY",
    "rhs": [
      {
        "prefix": "Net Sales ",
        "suffix": "YoY Growth in quarter ended Sep 2025 is 17.78% vs 41.11% in Sep 2024",
        "dir": -1
      },
      {
        "prefix": "Standalone Net Profit ",
        "suffix": "YoY Growth in quarter ended Sep 2025 is 37.03% vs 20.45% in Sep 2024",
        "dir": 1
      }
    ],
    "table": {
      "header": [
        "Sep'25",
        "Sep'24",
        "Change(%)"
      ],
      "body": [
        {
          "field": "Net Sales",
          "val1": "63.67",
          "val2": "54.06",
          "chgp": "17.78%",
          "chgp_class": "positive"
        },
        {
          "field": "Operating Profit (PBDIT) excl Other Income",
          "val1": "50.04",
          "val2": "40.46",
          "chgp": "23.68%",
          "chgp_class": "positive"
        },
        {
          "field": "Interest",
          "val1": "20.80",
          "val2": "15.54",
          "chgp": "33.85%",
          "chgp_class": "negative"
        },
        {
          "field": "Exceptional Items",
          "val1": "0.00",
          "val2": "0.00",
          "chgp": "",
          "chgp_class": "neutral"
        },
        {
          "field": "Standalone Net Profit",
          "val1": "24.46",
          "val2": "17.85",
          "chgp": "37.03%",
          "chgp_class": "positive"
        },
        {
          "field": "Operating Profit Margin (Excl OI)",
          "val1": "78.59%",
          "val2": "74.84%",
          "chgp": "3.75%",
          "chgp_class": "positive"
        }
      ]
    }
  },
  {
    "link": "half-yearly",
    "btn_text": "All Half Yearly Results",
    "header": "Half Yearly Results Snapshot (Standalone) - Sep'25",
    "rhs": [
      {
        "prefix": "Net Sales ",
        "suffix": " Growth in half year ended Sep 2025 is 17.09% vs 42.85% in Sep 2024",
        "dir": -1
      },
      {
        "prefix": "Standalone Net Profit ",
        "suffix": " Growth in half year ended Sep 2025 is 25.95% vs 29.46% in Sep 2024",
        "dir": -1
      }
    ],
    "table": {
      "header": [
        "Sep'25",
        "Sep'24",
        "Change(%)"
      ],
      "body": [
        {
          "field": "Net Sales",
          "val1": "123.11",
          "val2": "105.14",
          "chgp": "17.09%",
          "chgp_class": "positive"
        },
        {
          "field": "Operating Profit (PBDIT) excl Other Income",
          "val1": "57.12",
          "val2": "49.68",
          "chgp": "14.98%",
          "chgp_class": "positive"
        },
        {
          "field": "Interest",
          "val1": "39.03",
          "val2": "29.80",
          "chgp": "30.97%",
          "chgp_class": "negative"
        },
        {
          "field": "Exceptional Items",
          "val1": "0.00",
          "val2": "0.00",
          "chgp": "",
          "chgp_class": "neutral"
        },
        {
          "field": "Standalone Net Profit",
          "val1": "45.77",
          "val2": "36.34",
          "chgp": "25.95%",
          "chgp_class": "positive"
        },
        {
          "field": "Operating Profit Margin (Excl OI)",
          "val1": "46.40%",
          "val2": "47.25%",
          "chgp": "-0.85%",
          "chgp_class": "negative"
        }
      ]
    }
  },
  {
    "link": "nine-monthly",
    "btn_text": "All Nine Monthly Results",
    "header": "Nine Monthly Results Snapshot (Standalone) - Dec'24",
    "rhs": [
      {
        "prefix": "Net Sales ",
        "suffix": "YoY Growth in nine months ended Dec 2024 is 33.22% vs 42.26% in Dec 2023",
        "dir": -1
      },
      {
        "prefix": "Standalone Net Profit ",
        "suffix": "YoY Growth in nine months ended Dec 2024 is 18.58% vs 32.79% in Dec 2023",
        "dir": -1
      }
    ],
    "table": {
      "header": [
        "Dec'24",
        "Dec'23",
        "Change(%)"
      ],
      "body": [
        {
          "field": "Net Sales",
          "val1": "158.53",
          "val2": "119.00",
          "chgp": "33.22%",
          "chgp_class": "positive"
        },
        {
          "field": "Operating Profit (PBDIT) excl Other Income",
          "val1": "89.55",
          "val2": "73.68",
          "chgp": "21.54%",
          "chgp_class": "positive"
        },
        {
          "field": "Interest",
          "val1": "46.99",
          "val2": "29.48",
          "chgp": "59.40%",
          "chgp_class": "negative"
        },
        {
          "field": "Exceptional Items",
          "val1": "0.00",
          "val2": "0.00",
          "chgp": "",
          "chgp_class": "neutral"
        },
        {
          "field": "Standalone Net Profit",
          "val1": "53.11",
          "val2": "44.79",
          "chgp": "18.58%",
          "chgp_class": "positive"
        },
        {
          "field": "Operating Profit Margin (Excl OI)",
          "val1": "56.49%",
          "val2": "61.92%",
          "chgp": "-5.43%",
          "chgp_class": "negative"
        }
      ]
    }
  },
  {
    "link": "annual",
    "btn_text": "All Annual Results",
    "header": "Annual Results Snapshot (Standalone) - Mar'25",
    "rhs": [
      {
        "prefix": "Net Sales ",
        "suffix": "YoY Growth in year ended Mar 2025 is 29.83% vs 41.29% in Mar 2024",
        "dir": -1
      },
      {
        "prefix": "Standalone Net Profit ",
        "suffix": "YoY Growth in year ended Mar 2025 is 13.78% vs 38.86% in Mar 2024",
        "dir": -1
      }
    ],
    "table": {
      "header": [
        "Mar'25",
        "Mar'24",
        "Change(%)"
      ],
      "body": [
        {
          "field": "Net Sales",
          "val1": "215.06",
          "val2": "165.65",
          "chgp": "29.83%",
          "chgp_class": "positive"
        },
        {
          "field": "Operating Profit (PBDIT) excl Other Income",
          "val1": "97.62",
          "val2": "86.04",
          "chgp": "13.46%",
          "chgp_class": "positive"
        },
        {
          "field": "Interest",
          "val1": "64.91",
          "val2": "42.94",
          "chgp": "51.16%",
          "chgp_class": "negative"
        },
        {
          "field": "Exceptional Items",
          "val1": "0.00",
          "val2": "0.00",
          "chgp": "",
          "chgp_class": "neutral"
        },
        {
          "field": "Standalone Net Profit",
          "val1": "72.09",
          "val2": "63.36",
          "chgp": "13.78%",
          "chgp_class": "positive"
        },
        {
          "field": "Operating Profit Margin (Excl OI)",
          "val1": "45.39%",
          "val2": "51.94%",
          "chgp": "-6.55%",
          "chgp_class": "negative"
        }
      ]
    }
  }
]
Quarterly Results Snapshot (Standalone) - Sep'25 - YoYstock-summary
Sep'25
Sep'24
Change(%)
Net Sales
63.67
54.06
17.78%
Operating Profit (PBDIT) excl Other Income
50.04
40.46
23.68%
Interest
20.80
15.54
33.85%
Exceptional Items
0.00
0.00
Standalone Net Profit
24.46
17.85
37.03%
Operating Profit Margin (Excl OI)
78.59%
74.84%
3.75%
Values in Rs Cr.
Direction Arrows
Net Sales

YoY Growth in quarter ended Sep 2025 is 17.78% vs 41.11% in Sep 2024

Direction Arrows
Standalone Net Profit

YoY Growth in quarter ended Sep 2025 is 37.03% vs 20.45% in Sep 2024

Half Yearly Results Snapshot (Standalone) - Sep'25stock-summary
Sep'25
Sep'24
Change(%)
Net Sales
123.11
105.14
17.09%
Operating Profit (PBDIT) excl Other Income
57.12
49.68
14.98%
Interest
39.03
29.80
30.97%
Exceptional Items
0.00
0.00
Standalone Net Profit
45.77
36.34
25.95%
Operating Profit Margin (Excl OI)
46.40%
47.25%
-0.85%
Values in Rs Cr.
Direction Arrows
Net Sales

Growth in half year ended Sep 2025 is 17.09% vs 42.85% in Sep 2024

Direction Arrows
Standalone Net Profit

Growth in half year ended Sep 2025 is 25.95% vs 29.46% in Sep 2024

Nine Monthly Results Snapshot (Standalone) - Dec'24stock-summary
Dec'24
Dec'23
Change(%)
Net Sales
158.53
119.00
33.22%
Operating Profit (PBDIT) excl Other Income
89.55
73.68
21.54%
Interest
46.99
29.48
59.40%
Exceptional Items
0.00
0.00
Standalone Net Profit
53.11
44.79
18.58%
Operating Profit Margin (Excl OI)
56.49%
61.92%
-5.43%
Values in Rs Cr.
Direction Arrows
Net Sales

YoY Growth in nine months ended Dec 2024 is 33.22% vs 42.26% in Dec 2023

Direction Arrows
Standalone Net Profit

YoY Growth in nine months ended Dec 2024 is 18.58% vs 32.79% in Dec 2023

Annual Results Snapshot (Standalone) - Mar'25stock-summary
Mar'25
Mar'24
Change(%)
Net Sales
215.06
165.65
29.83%
Operating Profit (PBDIT) excl Other Income
97.62
86.04
13.46%
Interest
64.91
42.94
51.16%
Exceptional Items
0.00
0.00
Standalone Net Profit
72.09
63.36
13.78%
Operating Profit Margin (Excl OI)
45.39%
51.94%
-6.55%
Values in Rs Cr.
Direction Arrows
Net Sales

YoY Growth in year ended Mar 2025 is 29.83% vs 41.29% in Mar 2024

Direction Arrows
Standalone Net Profit

YoY Growth in year ended Mar 2025 is 13.78% vs 38.86% in Mar 2024

stock-summaryCompany CV
About CSL Finance Ltd stock-summary
stock-summary
CSL Finance Ltd
Micro Cap
Non Banking Financial Company (NBFC)
CSL Finance Ltd (Formerly known Consolidated Securities Limited) was incorporated on December 28, 1992. The Company is engaged in the business of providing the finance facilities to small and medium size business units to fulfill their financial needs. The complete business of CSL can be classified into two broader segments of SME business and Wholesale business.
Company Coordinates stock-summary
Company Details
410-412 18/12 4th Floor W.E.A, Arya Samaj Road Karol Bagh New Delhi New Delhi : 110005
stock-summary
Tel: 91-11-42503441-44
stock-summary
info@consec.in
Registrar Details
MAS Services Ltd, T-34 , 2nd Floor, Okhla Industrial Area, Phase - II, New Delhi