
Compare Cubex Tubings with Similar Stocks
Stock DNA
Industrial Products
INR 125 Cr (Micro Cap)
17.00
15
0.00%
0.47
8.94%
1.50
Total Returns (Price + Dividend) 
Cubex Tubings for the last several years.
Risk Adjusted Returns v/s
Returns Beta

News
Cubex Tubings Ltd Upgraded to Sell on Technical Improvement Despite Financial Challenges
Cubex Tubings Ltd, a micro-cap player in the Industrial Products sector, has seen its investment rating upgraded from Strong Sell to Sell as of 15 June 2026. This change reflects a nuanced reassessment across four key parameters: quality, valuation, financial trend, and technicals. Despite recent quarterly setbacks, the company’s long-term growth prospects and improved technical indicators have contributed to a more balanced outlook for investors.
Read full news article
Cubex Tubings Ltd is Rated Strong Sell
Cubex Tubings Ltd is rated Strong Sell by MarketsMOJO, with this rating last updated on 18 May 2026. However, the analysis and financial metrics discussed here reflect the stock’s current position as of 01 June 2026, providing investors with the most up-to-date view of the company’s fundamentals, returns, and technical outlook.
Read full news article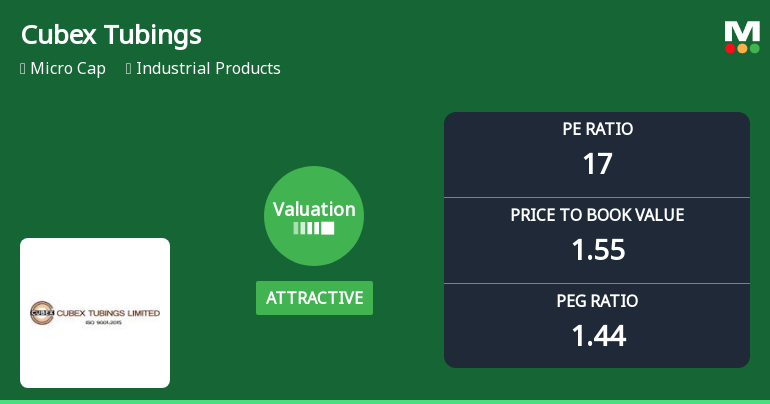
Cubex Tubings Ltd Valuation Shifts Signal Attractive Entry Amid Mixed Returns
Cubex Tubings Ltd, a micro-cap player in the Industrial Products sector, has seen its valuation parameters shift notably, with its price-to-earnings (P/E) and price-to-book value (P/BV) ratios moving into more attractive territory. Despite a recent downgrade in its Mojo Grade to Strong Sell, the stock’s valuation now presents a compelling case for investors seeking value within a challenging market backdrop.
Read full news article Announcements
Compliances-Reg.24(A)-Annual Secretarial Compliance
25-May-2026 | Source : BSEAnnual Secretarial Compliance - 2025-26
AUDTIED RESULTS FOR THE QUARTER AND YEAR ENDED 31.03.2026
15-May-2026 | Source : BSEAUDTIED RESULTS FOR THE QUARTER AND YEAR ENDED 31.03.2026
Board Meeting Outcome for AUDTIED RESULTS FOR THE QUARTER AND YEAR ENDED 31.03.2026
15-May-2026 | Source : BSEAUDTIED RESULTS FOR THE QUARTER AND YEAR ENDED 31.03.2026
Corporate Actions

No Upcoming Board Meetings

No Dividend history available

No Splits history available

No Bonus history available

No Rights history available
Quality key factors
Valuation key factors
Technicals key factors
 Technical Indicator Scale: Bearish, Mildly Bearish, Sideways, Mildly Bullish, Bullish Turned
 Shareholding Snapshot : Mar 2026
Shareholding Compare (%holding)
Non Institution
None
Held by 3 Schemes (0.32%)
Held by 3 FIIs (0.19%)
Nadol Trading Pvt Ltd (14.84%)
Swarnim Avenues Private Limited . (3.62%)
48.81%
Quarterly Results Snapshot (Standalone) - Mar'26 - QoQ

QoQ Growth in quarter ended Mar 2026 is 19.15% vs 1.80% in Dec 2025

QoQ Growth in quarter ended Mar 2026 is -55.95% vs 78.74% in Dec 2025
Half Yearly Results Snapshot (Standalone) - Sep'25
Growth in half year ended Sep 2025 is 12.20% vs -3.45% in Sep 2024
Growth in half year ended Sep 2025 is 34.39% vs 12.76% in Sep 2024
Nine Monthly Results Snapshot (Standalone) - Dec'25
YoY Growth in nine months ended Dec 2025 is 8.59% vs 6.95% in Dec 2024
YoY Growth in nine months ended Dec 2025 is 39.77% vs 46.46% in Dec 2024
Annual Results Snapshot (Standalone) - Mar'26
YoY Growth in year ended Mar 2026 is 7.82% vs 20.98% in Mar 2025
YoY Growth in year ended Mar 2026 is 11.86% vs 66.92% in Mar 2025
About Cubex Tubings Ltd

Company Coordinates


