
Compare Cubex Tubings with Similar Stocks
Stock DNA
Industrial Products
INR 112 Cr (Micro Cap)
15.00
13
0.00%
0.47
8.94%
1.35
Total Returns (Price + Dividend) 
Cubex Tubings for the last several years.
Risk Adjusted Returns v/s
Returns Beta

News
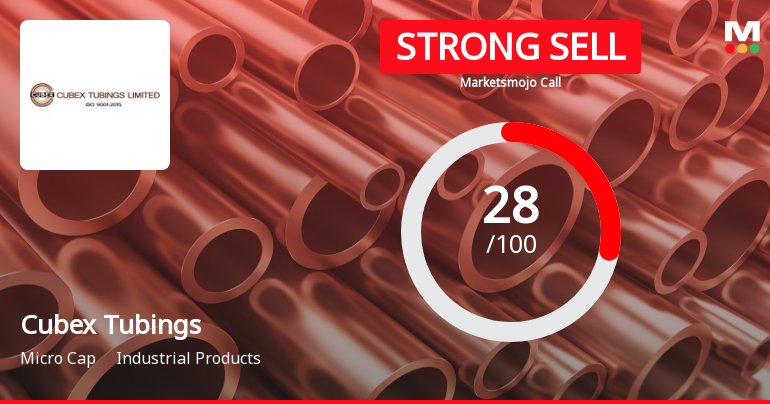
Cubex Tubings Ltd is Rated Strong Sell
Cubex Tubings Ltd is rated Strong Sell by MarketsMOJO, with this rating last updated on 06 July 2026. However, the analysis and financial metrics discussed here reflect the stock's current position as of 12 July 2026, providing investors with the most up-to-date view of the company’s performance and outlook.
Read full news article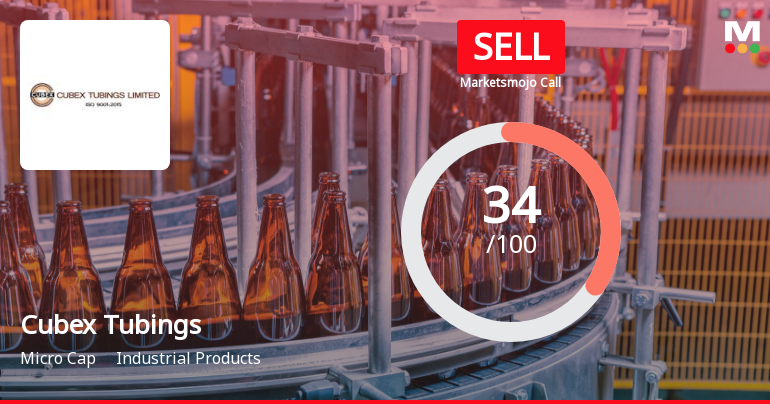
Cubex Tubings Ltd Upgraded to Sell on Technical Improvements and Valuation Appeal
Cubex Tubings Ltd has seen its investment rating upgraded from Strong Sell to Sell as of 29 June 2026, reflecting a nuanced shift in its technical outlook despite ongoing financial challenges. The company’s micro-cap status, combined with a complex interplay of valuation, quality, financial trends, and technical indicators, has led to this recalibration of its Mojo Grade to 34.0. This article analyses the key factors driving this change and what it means for investors navigating the industrial products sector.
Read full news article
Cubex Tubings Ltd Downgraded to Strong Sell Amid Deteriorating Technicals and Financials
Cubex Tubings Ltd, a micro-cap player in the Industrial Products sector, has been downgraded from a Sell to a Strong Sell rating as of 23 June 2026. This revision reflects deteriorating technical indicators, disappointing quarterly financial results, and a cautious valuation outlook despite the company’s robust long-term sales growth. Investors should carefully consider these factors amid the stock’s underperformance relative to broader market benchmarks.
Read full news article Announcements
Price movement
20-Sep-2019 | Source : NSE
| Significant movement in price has been observed in Cubex Tubings Limited. The Exchange, in order to ensure that investors have latest relevant information about the company and to inform the market place so that the interest of the investors is safeguarded, had written to the company. Cubex Tubings Limited has submitted their response. |
Price movement
19-Sep-2019 | Source : NSE
| Significant movement in price has been observed in Cubex Tubings Limited. The Exchange, in order to ensure that investors have latest relevant information about the company and to inform the market place so that the interest of the investors is safeguarded, has written to the company. The response from the company is awaited. |
Updates
03-Sep-2019 | Source : NSE
| Cubex Tubings Limited has informed the Exchange regarding 'Pursuant to the applicable Regulations of SEBI (Listing Obligations and Disclosures Requirements) Regulations 2015, this is to inform you that, the meeting of the Board of Directors of the Company, held on Tuesday, 13th August 2019 at the Registered Office of the Company, inter-alia, among the other items discussed the attached items of business:'. |
Corporate Actions

No Upcoming Board Meetings

No Dividend history available

No Splits history available

No Bonus history available

No Rights history available
Quality key factors
Valuation key factors
Technicals key factors
 Technical Indicator Scale: Bearish, Mildly Bearish, Sideways, Mildly Bullish, Bullish Turned
 Shareholding Snapshot : Mar 2026
Shareholding Compare (%holding)
Non Institution
None
Held by 3 Schemes (0.32%)
Held by 3 FIIs (0.19%)
Nadol Trading Pvt Ltd (14.84%)
Swarnim Avenues Private Limited . (3.62%)
48.81%
Quarterly Results Snapshot (Standalone) - Mar'26 - QoQ

QoQ Growth in quarter ended Mar 2026 is 19.15% vs 1.80% in Dec 2025

QoQ Growth in quarter ended Mar 2026 is -55.95% vs 78.74% in Dec 2025
Half Yearly Results Snapshot (Standalone) - Sep'25
Growth in half year ended Sep 2025 is 12.20% vs -3.45% in Sep 2024
Growth in half year ended Sep 2025 is 34.39% vs 12.76% in Sep 2024
Nine Monthly Results Snapshot (Standalone) - Dec'25
YoY Growth in nine months ended Dec 2025 is 8.59% vs 6.95% in Dec 2024
YoY Growth in nine months ended Dec 2025 is 39.77% vs 46.46% in Dec 2024
Annual Results Snapshot (Standalone) - Mar'26
YoY Growth in year ended Mar 2026 is 7.82% vs 20.98% in Mar 2025
YoY Growth in year ended Mar 2026 is 11.86% vs 66.92% in Mar 2025
About Cubex Tubings Ltd

Company Coordinates


