
Compare Cupid with Similar Stocks
Dashboard
The company is Net-Debt Free
Healthy long term growth as Operating profit has grown by an annual rate 30.35%
With a growth in Net Sales of 28.3%, the company declared Outstanding results in Mar 26
Market Beating performance in long term as well as near term
With its market cap of Rs 20,923 cr, it is the biggest company in the sector and constitutes 67.52% of the entire sector
Total Returns (Price + Dividend) 
Latest dividend: 3 per share ex-dividend date: Sep-18-2023
Risk Adjusted Returns v/s
Returns Beta

News
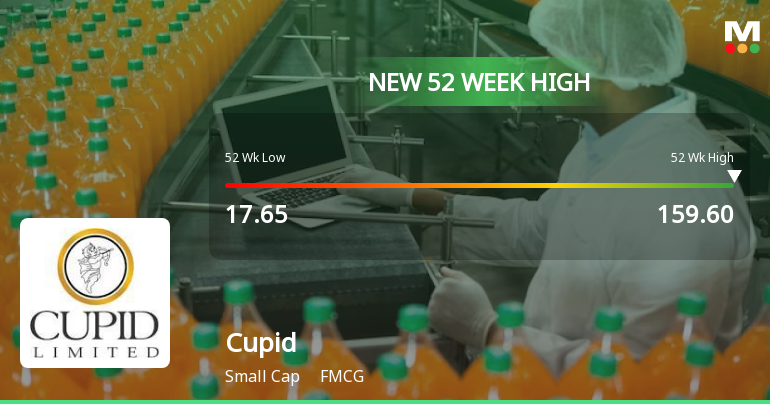
Broad-Based Technical Strength Lifts Cupid Ltd to 52-Week High of Rs 159.6
Surging to a fresh 52-week high of Rs 159.6 on 12 Jun 2026, Cupid Ltd has demonstrated remarkable price momentum, extending an eight-day winning streak that has delivered a 23.26% gain in that period alone. This milestone caps a spectacular 732.37% rally over the past year, dwarfing the Sensex’s 8.66% decline and underscoring the stock’s exceptional outperformance within the FMCG sector.
Read full news article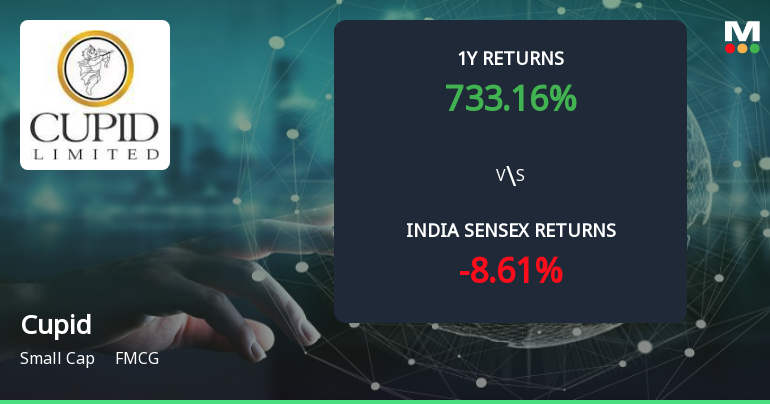
Cupid Ltd Delivers 728% in One Year — But Profit Growth Trails: Inside the Multibagger's Numbers
A 728.19% stock return in one year. A 164.5% growth in net profit over the same period. The gap between those two numbers — roughly 563 percentage points — is driven largely by the market's willingness to pay a significantly higher multiple for each rupee of Cupid Ltd's earnings. That divergence is the central story behind this multibagger rally.
Read full news article
Announcements
Intimation Of Disclosure Under Regulation 29(2) Of SEBI (SAST) Regulations 2011
03-Jun-2026 | Source : BSECupid Limited is hereby informing BSE about Disclosure under Regulation 29 (2) of SEBI (SAST) Regulations 2011
Disclosures under Reg. 29(2) of SEBI (SAST) Regulations 2011
03-Jun-2026 | Source : BSEThe Exchange has received the disclosure under Regulation 29(2) of SEBI (Substantial Acquisition of Shares & Takeovers) Regulations 2011 for Aditya Kumar Halwasiya
Disclosures under Reg. 29(2) of SEBI (SAST) Regulations 2011
03-Jun-2026 | Source : BSEThe Exchange has received the disclosure under Regulation 29(2) of SEBI (Substantial Acquisition of Shares & Takeovers) Regulations 2011 for Aditya Kumar Halwasiya
Corporate Actions

No Upcoming Board Meetings

Cupid Ltd has declared 30% dividend, ex-date: 18 Sep 23

Cupid Ltd has announced 1:10 stock split, ex-date: 04 Apr 24

Cupid Ltd has announced 4:1 bonus issue, ex-date: 09 Mar 26

No Rights history available
Quality key factors
Valuation key factors
Technicals key factors
 Technical Indicator Scale: Bearish, Mildly Bearish, Sideways, Mildly Bullish, Bullish Turned
 Shareholding Snapshot : Mar 2026
Shareholding Compare (%holding)
Non Institution
24.7852
Held by 1 Schemes (0.0%)
Held by 18 FIIs (0.91%)
Aditya Kumar Halwasiya (32.9%)
Setu Securities Pvt Ltd (3.6%)
24.74%
Quarterly Results Snapshot (Consolidated) - Mar'26 - QoQ

QoQ Growth in quarter ended Mar 2026 is 28.30% vs 10.72% in Dec 2025

QoQ Growth in quarter ended Mar 2026 is 10.45% vs 36.05% in Dec 2025
Half Yearly Results Snapshot (Consolidated) - Sep'25
Not Applicable: The company has declared_date for only one period
Not Applicable: The company has declared_date for only one period
Nine Monthly Results Snapshot (Consolidated) - Dec'25
YoY Growth in nine months ended Dec 2025 is 87.15% vs 21.43% in Dec 2024
YoY Growth in nine months ended Dec 2025 is 145.05% vs 131.08% in Dec 2024
Annual Results Snapshot (Consolidated) - Mar'26
YoY Growth in year ended Mar 2026 is 94.92% vs 7.27% in Mar 2025
YoY Growth in year ended Mar 2026 is 164.69% vs 2.61% in Mar 2025
About Cupid Ltd

Company Coordinates


