
Compare CWD with Similar Stocks
Total Returns (Price + Dividend) 
CWD for the last several years.
Risk Adjusted Returns v/s
Returns Beta

News

CWD Ltd Technical Momentum Shifts Amid Mixed Market Signals
CWD Ltd, a micro-cap player in the Electronics & Appliances sector, has experienced a notable shift in its technical momentum, moving from a mildly bearish stance to a sideways trend. Despite a modest day gain of 0.24% to close at ₹295.00, the stock’s technical indicators present a complex picture, reflecting mixed signals across weekly and monthly timeframes. This analysis delves into the recent technical parameter changes, momentum oscillators, and moving averages to provide a comprehensive view of CWD Ltd’s current market positioning.
Read full news article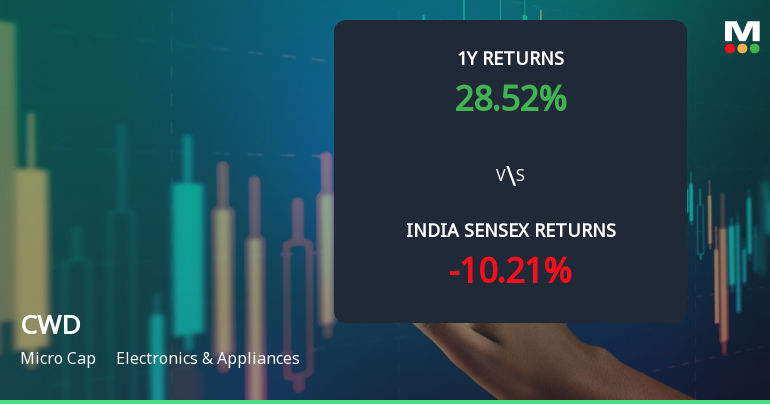
CWD Ltd Technical Momentum Shifts Amid Bearish Signals
CWD Ltd, a micro-cap player in the Electronics & Appliances sector, has experienced a notable shift in its technical momentum, with recent indicators signalling a transition from sideways movement to a mildly bearish trend. The stock’s current price of ₹294.30 reflects a 3.54% decline from the previous close, underscoring growing investor caution amid mixed technical signals and a downgrade in its Mojo Grade to Sell.
Read full news article
CWD Ltd is Rated Sell by MarketsMOJO
CWD Ltd is rated Sell by MarketsMOJO, with this rating last updated on 08 June 2026. While the rating change occurred on that date, the analysis and financial metrics discussed here reflect the stock’s current position as of 09 June 2026, providing investors with the most up-to-date view of the company’s fundamentals and market performance.
Read full news article Announcements
Announcement under Regulation 30 (LODR)-Press Release / Media Release
30-May-2026 | Source : BSEPress Release as per Regulation 30 of SEBI (LODR) Regulations 2015 of CWD Limited for financial results of half year and year ended March 31 2026
Announcement under Regulation 30 (LODR)-Allotment
30-May-2026 | Source : BSEAllotment of Equity Shares pursuant to conversion of warrants
Statement Of Deviation And Variation For The Half Year Ended March 31 2026
30-May-2026 | Source : BSEStatement of Deviation and Variation for the half year ended March 31 2026
Corporate Actions

No Upcoming Board Meetings

No Dividend history available

No Splits history available

CWD Ltd has announced 4:1 bonus issue, ex-date: 02 Jan 26

No Rights history available
Quality key factors
Valuation key factors
Technicals key factors
 Technical Indicator Scale: Bearish, Mildly Bearish, Sideways, Mildly Bullish, Bullish Turned
 Shareholding Snapshot : Jun 2026
Shareholding Compare (%holding)
Promoters
None
Held by 0 Schemes
Held by 0 FIIs
Sodagudi Siddhartha Xavier (29.13%)
Arc Finance Limited (3.03%)
21.78%
Half Yearly Results Snapshot (Standalone) - Mar'26

Growth in half year ended Mar 2026 is 164.12% vs 52.05% in Sep 2025
Growth in half year ended Mar 2026 is 82.99% vs 0.23% in Sep 2025
Nine Monthly Results Snapshot (Consolidated) - Sep'23
YoY Growth in nine months ended Sep 2023 is 272.57% vs -13.70% in Sep 2023
YoY Growth in nine months ended Sep 2023 is 138.07% vs -282.46% in Sep 2023
Annual Results Snapshot (Standalone) - Mar'26
YoY Growth in year ended Mar 2026 is 343.25% vs 56.82% in Mar 2025
YoY Growth in year ended Mar 2026 is 390.84% vs 122.12% in Mar 2025
About CWD Ltd

Company Coordinates


