
Compare Cyient DLM with Similar Stocks
Stock DNA
Industrial Manufacturing
INR 3,537 Cr (Small Cap)
49.00
50
0.00%
0.03
7.24%
3.38
Total Returns (Price + Dividend) 
Cyient DLM for the last several years.
Risk Adjusted Returns v/s
Returns Beta

News

Cyient DLM Ltd Technical Momentum Shifts Amid Mixed Market Signals
Shares of Cyient DLM Ltd have experienced a notable shift in technical momentum, reflecting a complex interplay of bullish and bearish signals across key indicators. The stock’s recent price action and technical parameters suggest a transition from a mildly bullish trend to a sideways movement, prompting a reassessment of its near-term outlook within the industrial manufacturing sector.
Read full news article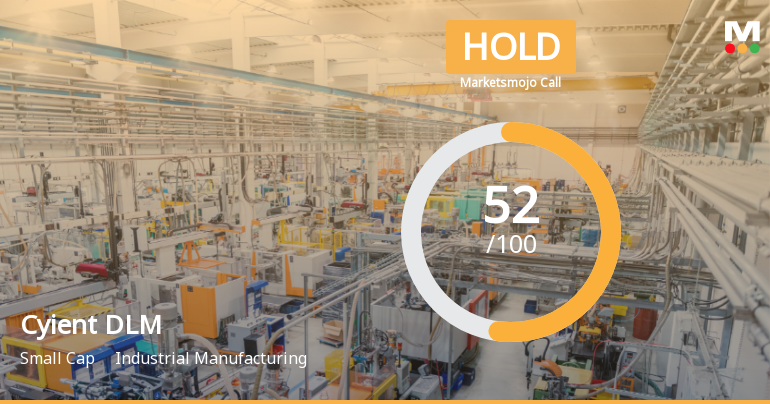
Cyient DLM Ltd Upgraded to Hold as Technicals Improve Amid Mixed Financials
Cyient DLM Ltd has seen its investment rating upgraded from Sell to Hold, reflecting a nuanced improvement across technical indicators and valuation metrics despite flat financial performance. The company’s technical trend has shifted to mildly bullish, while valuation and financial trends present a mixed picture, prompting a cautious but more optimistic stance from analysts.
Read full news article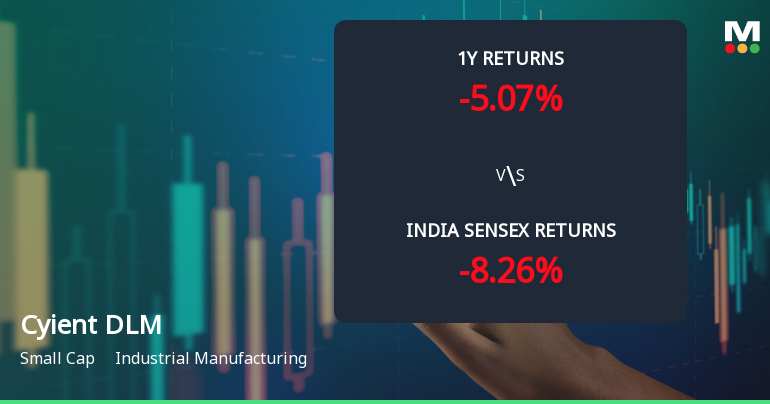
Cyient DLM Ltd Shows Signs of Technical Momentum Shift Amid Mixed Indicator Signals
Cyient DLM Ltd has demonstrated a notable shift in price momentum, moving from a sideways trend to a mildly bullish stance, supported by a blend of technical indicators that suggest cautious optimism for investors in this industrial manufacturing small-cap.
Read full news article Announcements
Announcement under Regulation 30 (LODR)-Newspaper Publication
09-Jun-2026 | Source : BSEPlease find enclosed the Newspaper Advertisement of 33rd AGM Notice and E-voting information of the company
Announcement under Regulation 30 (LODR)-Analyst / Investor Meet - Intimation
08-Jun-2026 | Source : BSEPlease find enclosed the schedule of the investor meeting on 11 June 2026
Reg. 34 (1) Annual Report.
08-Jun-2026 | Source : BSEPlease find enclosed Annual Report for FY 2025-26
Corporate Actions

No Upcoming Board Meetings

No Dividend history available

No Splits history available

No Bonus history available

No Rights history available
Quality key factors
Valuation key factors
Technicals key factors
 Technical Indicator Scale: Bearish, Mildly Bearish, Sideways, Mildly Bullish, Bullish Turned
 Shareholding Snapshot : Mar 2026
Shareholding Compare (%holding)
Promoters
None
Held by 9 Schemes (26.05%)
Held by 15 FIIs (0.79%)
Cyient Limited (52.12%)
Hdfc Mutual Fund (9.72%)
16.77%
Quarterly Results Snapshot (Consolidated) - Mar'26 - QoQ

QoQ Growth in quarter ended Mar 2026 is 21.67% vs -2.34% in Dec 2025
QoQ Growth in quarter ended Mar 2026 is 99.82% vs -65.07% in Dec 2025
Half Yearly Results Snapshot (Consolidated) - Sep'25

Growth in half year ended Sep 2025 is -9.00% vs 27.18% in Sep 2024
Growth in half year ended Sep 2025 is 52.05% vs 30.18% in Sep 2024
Nine Monthly Results Snapshot (Consolidated) - Dec'25
YoY Growth in nine months ended Dec 2025 is -18.25% vs 31.51% in Dec 2024
YoY Growth in nine months ended Dec 2025 is 37.26% vs -3.67% in Dec 2024
Annual Results Snapshot (Consolidated) - Mar'26
YoY Growth in year ended Mar 2026 is -16.99% vs 27.50% in Mar 2025
YoY Growth in year ended Mar 2026 is 7.64% vs 11.24% in Mar 2025
About Cyient DLM Ltd

Company Coordinates


