
Compare D P Wires with Similar Stocks
Dashboard
Company has a Debt to Equity ratio (avg) of 0.05 times
Poor long term growth as Operating profit has grown by an annual rate -14.13% of over the last 5 years
The company has declared positive results in Mar'2026 after 9 consecutive negative quarters
With ROE of 6.9, it has a Very Expensive valuation with a 1.3 Price to Book Value
Majority shareholders : Promoters
Consistent Underperformance against the benchmark over the last 3 years
Stock DNA
Iron & Steel Products
INR 328 Cr (Micro Cap)
19.00
26
0.00%
-0.04
6.94%
1.31
Total Returns (Price + Dividend) 
Latest dividend: 1.0385531848621707 per share ex-dividend date: Sep-22-2023
Risk Adjusted Returns v/s
Returns Beta

News

D P Wires Ltd Upgraded to Hold as Technicals Improve Amidst Valuation Concerns
D P Wires Ltd, a micro-cap player in the Iron & Steel Products sector, has seen its investment rating upgraded from Sell to Hold as of 23 June 2026. This change reflects a nuanced shift in the company’s technical indicators and financial performance, despite its valuation moving into the very expensive territory. Investors are advised to consider the mixed signals from quality, valuation, financial trends, and technicals before making decisions.
Read full news article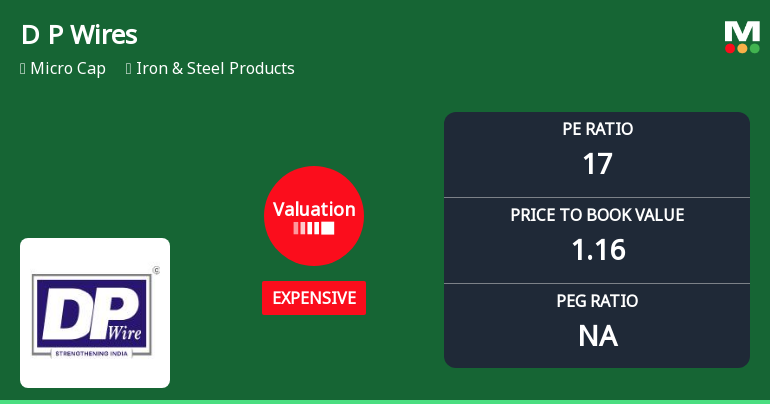
D P Wires Ltd Valuation Shifts Signal Growing Price Pressure Amid Sector Dynamics
D P Wires Ltd, a micro-cap player in the Iron & Steel Products sector, has seen a notable shift in its valuation parameters, moving from a fair to an expensive rating. This change, coupled with a recent downgrade in its Mojo Grade from Hold to Sell, signals a reassessment of the stock’s price attractiveness relative to its historical averages and peer group. Investors should carefully analyse these developments amid the company’s recent price gains and sector dynamics.
Read full news article
D P Wires Ltd is Rated Sell by MarketsMOJO
D P Wires Ltd is rated 'Sell' by MarketsMOJO, with this rating last updated on 08 June 2026. However, the analysis and financial metrics discussed here reflect the stock's current position as of 22 June 2026, providing investors with an up-to-date view of the company’s fundamentals, returns, and market performance.
Read full news article Announcements
D P Wires Limited - Reply to Clarification- Financial results
22-Nov-2019 | Source : NSED P Wires Limitedires Limited for the quarter ended 30-Sep-2019 with respect to Regulation 33 of the SEBI (Listing Obligations and Disclosure Requirements) Regulations, 2015.
D P Wires Limited - Financial Results Updates
18-Nov-2019 | Source : NSED P Wires Limited has informed the Exchange regarding Financial Results.
D P Wires Limited - Outcome of Board Meeting
15-Nov-2019 | Source : NSED P Wires Limited has informed the Exchange regarding Board meeting held on November 14, 2019.
Corporate Actions

No Upcoming Board Meetings

D P Wires Ltd has declared 12% dividend, ex-date: 22 Sep 23

No Splits history available

D P Wires Ltd has announced 1:7 bonus issue, ex-date: 08 Nov 23

No Rights history available
Quality key factors
Valuation key factors
Technicals key factors
 Technical Indicator Scale: Bearish, Mildly Bearish, Sideways, Mildly Bullish, Bullish Turned
 Shareholding Snapshot : Mar 2026
Shareholding Compare (%holding)
Promoters
None
Held by 0 Schemes
Held by 2 FIIs (0.01%)
None
Amitabh Harivansh Rai Bachchan (2.11%)
22.66%
Quarterly Results Snapshot (Standalone) - Mar'26 - YoY

YoY Growth in quarter ended Mar 2026 is -6.28% vs -33.99% in Mar 2025
YoY Growth in quarter ended Mar 2026 is 132.43% vs -58.86% in Mar 2025
Half Yearly Results Snapshot (Standalone) - Sep'25
Growth in half year ended Sep 2025 is -22.02% vs -39.07% in Sep 2024

Growth in half year ended Sep 2025 is -63.74% vs -34.51% in Sep 2024
Nine Monthly Results Snapshot (Standalone) - Dec'25
YoY Growth in nine months ended Dec 2025 is -27.25% vs -39.08% in Dec 2024
YoY Growth in nine months ended Dec 2025 is -54.98% vs -31.41% in Dec 2024
Annual Results Snapshot (Standalone) - Mar'26
YoY Growth in year ended Mar 2026 is -22.59% vs -38.11% in Mar 2025
YoY Growth in year ended Mar 2026 is -20.81% vs -38.88% in Mar 2025
About D P Wires Ltd

Company Coordinates


