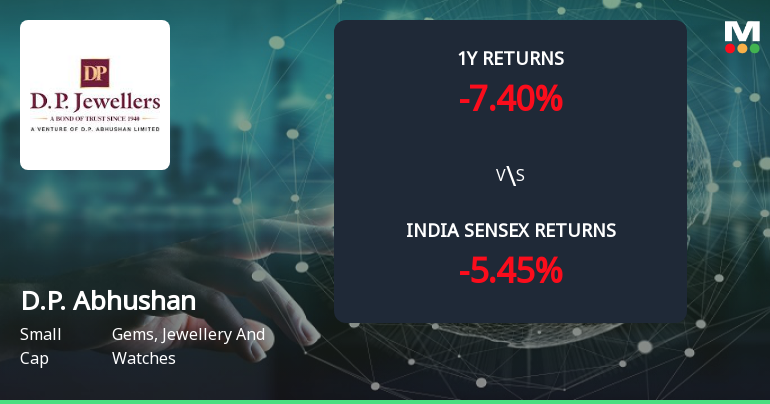
D.P. Abhushan

  • Market Cap: Small Cap
  • Industry: Gems, Jewellery And Watches
  • ISIN: INE266Y01019
  • NSEID: DPABHUSHAN
  • BSEID: 544161
INR
1,456.00
-80.4 (-5.23%)
BSENSE

Aug 25, 03:32 PM

BSE+NSE Vol: 40.24 k

  • Price Points
  • Score
  • Mojo Parameters
  • Total Return
  • News and Corporate Actions
  • Key factors
  • Shareholding
  • Financials
  • CompanyCV
stock-summaryPrice Point
High/Low

1Day

52 Week

Valuation
Technical
Day's Volume

CASH

40.24 k (0.04%) Volume

Shareholding (Jun 2026)

FII

0.23%

Held by 18 FIIs

DII

0.00%

Held by 0 DIIs

Promoter

74.89%

Why is D.P. Abhushan Ltd falling/rising?

25-Aug-2026

As of 24-Aug, D.P. Abhushan Ltd's stock price is rising to 1,536.40, reflecting a 3.85% increase. This growth is driven by strong financial fundamentals, increased investor interest, and consistent performance over the past weeks.

As of 24-Aug, D.P. Abhushan Ltd's stock price is rising, currently at 1,536.40, reflecting a change of 56.9 (3.85%) upward. This positive movement can be attributed to several factors. The stock has outperformed the sector by 4.42% today and has been on a consecutive gain streak for the last five days, accumulating a total return of 9.51% during this period. Additionally, the stock reached an intraday high of Rs 1568.6, marking a 6.02% increase.<BR><BR>Investor participation has also increased, with delivery volume rising by 71.3% compared to the five-day average, indicating growing interest in the stock. Furthermore, D.P. Abhushan is trading above its moving averages across various time frames, which typically signals positive momentum.<BR><BR>Financially, the company demonstrates strong fundamentals, with a low Debt to EBITDA ratio of 0.95 times, indicating a solid ability to service its debt. The company has reported impressive growth in net sales and operating profit, with net sales increasing at an annual rate of 26.49% and operating profit at 45.95%. The net profit has surged by 76.96%, and the company has consistently declared positive results for the last 15 quarters. These strong financial indicators, coupled with an attractive valuation compared to its peers, contribute to the stock's upward trajectory.

View full answer

Who are in the management team of D.P. Abhushan?

14-Aug-2026

The management team of D.P. Abhushan includes Santosh Kataria (Chairman & Managing Director), Anil Kataria (Whole-time Director), Renu Kataria (Director), and five Independent Directors: Mukesh Jain, Deepak Gadia, Sanskar Kothari, and Apurva Chordia. This diverse team brings a wealth of experience to the company.

The management team of D.P. Abhushan includes the following individuals:<BR><BR>1. **Santosh Kataria** - Chairman & Managing Director<BR>2. **Anil Kataria** - Whole-time Director<BR>3. **Renu Kataria** - Director<BR>4. **Mukesh Jain** - Independent Director<BR>5. **Deepak Gadia** - Independent Director<BR>6. **Sanskar Kothari** - Independent Director<BR>7. **Apurva Chordia** - Independent Director<BR><BR>This team brings a diverse set of experiences and expertise to the company. If you have any more questions about D.P. Abhushan or its operations, feel free to ask!

View full answer

What does D.P. Abhushan do?

14-Aug-2026

D.P. Abhushan Ltd is a Small Cap company in the Gems, Jewellery and Watches industry, formed in 2003 and converted to a Public Limited Company in 2017. As of June 2026, it reported net sales of 852 Cr and a net profit of 64 Cr.

Overview:<BR>D.P. Abhushan Ltd operates in the Gems, Jewellery and Watches industry and is categorized as a Small Cap company.<BR><BR>History:<BR>D.P. Abhushan Ltd was originally formed as a partnership firm named "M/s D. P. Jewellers" in 2003. The firm was renamed to "M/s D. P. Abhushan" in 2017 and subsequently converted to a Public Limited Company on May 2, 2017. The most recent quarterly results reported net sales and profit for June 2026.<BR><BR>Financial Snapshot:<BR>Net Sales: 852 Cr (Quarterly Results - Jun 2026) <BR>Net Profit: 64 Cr (Quarterly Results - Jun 2026) <BR>Market Cap: INR 3,224 Cr (Small Cap)<BR><BR>Key Metrics:<BR>P/E: 13.00 <BR>Industry P/E: 21 <BR>Dividend Yield: 0.00% <BR>Debt Equity: 0.42 <BR>Return on Equity: 37.92% <BR>Price to Book: 5.13 <BR><BR>Contact Details:<BR>Address: 138 Chandani Chowk, Ratlam Madhya Pradesh: 457001 <BR>Tel: 91-7412-490966/408900 <BR>Email: dpj@dpjewellers.com <BR>Website: http://www.dpjewellers.com

View full answer

Who are the peers of the D.P. Abhushan?

14-Aug-2026

D.P. Abhushan's peers include Timex Group, Senco Gold, Goldiam Intl., KDDL Ltd, Vaibhav Global, Rajesh Exports, Shringar House, Khazanchi Jewell, and Shanti Gold. In terms of performance, Timex Group leads with a 1-year return of 96.01%, while D.P. Abhushan has a return of -15.11%.

Peers: The peers of D.P. Abhushan are Timex Group, Senco Gold, Goldiam Intl., KDDL Ltd, Vaibhav Global, Rajesh Exports, Shringar House, Khazanchi Jewell, and Shanti Gold.<BR><BR>Quality Snapshot: Excellent management risk is observed at Senco Gold, KDDL Ltd, Shringar House, and Khazanchi Jewell, while Average management risk is found at Timex Group, Goldiam Intl., D.P. Abhushan, Vaibhav Global, Rajesh Exports, and the rest. Growth is excellent for Timex Group, Senco Gold, KDDL Ltd, D.P. Abhushan, Shringar House, Khazanchi Jewell, and the rest, while below average growth is noted for Goldiam Intl., Vaibhav Global, and Rajesh Exports. Capital structure is excellent at Timex Group, Goldiam Intl., Vaibhav Global, Rajesh Exports, Shringar House, Khazanchi Jewell, and the rest, while below average capital structure is seen at Senco Gold and Shanti Gold.<BR><BR>Return Snapshot: The peer with the highest 1-year return is Timex Group at 96.01%, while Rajesh Exports has the lowest at -54.81%. D.P. Abhushan's 1-year return is -15.11%, which is higher than Rajesh Exports but lower than Timex Group. Additionally, the six-month return is negative for Rajesh Exports and Vaibhav Global.

View full answer

How big is D.P. Abhushan?

14-Aug-2026

As of 14th August, D.P. Abhushan Ltd has a market capitalization of 3,127.00 Cr, with recent net sales of 1,731.38 Cr and a net profit of 40.54 Cr over the last four quarters.

As of 14th August, <BR><BR>Market Cap: D.P. Abhushan Ltd has a market capitalization of 3,127.00 Cr, categorizing it as a Small Cap company.<BR><BR>Recent Quarterly Performance: The sum of Net Sales for the latest 4 quarters is 1,731.38 Cr, while the sum of Net Profit for the same period is 40.54 Cr.<BR><BR>Balance Sheet Snapshot: The reporting period is March 2022, with Shareholder's Funds amounting to 138.06 Cr and Total Assets valued at 413.61 Cr.

View full answer

Should I buy, sell or hold D.P. Abhushan Ltd?

06-Aug-2026

Are D.P. Abhushan Ltd latest results good or bad?

23-Jan-2026

D.P. Abhushan Ltd's latest Q3 FY26 results are strong, with a record net profit of ₹73.35 crore and revenue of ₹1,222.38 crore, alongside a high return on equity of 29.67%. However, the stock has underperformed with a one-year return of -18.43%, indicating investor sentiment issues despite solid fundamentals.

D.P. Abhushan Ltd's latest results for Q3 FY26 are quite strong, showcasing exceptional operational performance. The company reported a net profit of ₹73.35 crore, marking an all-time high, and revenue reached ₹1,222.38 crore, which is a record for any quarter in its history. Additionally, the return on equity stands at an impressive 29.67%, which is industry-leading.<BR><BR>Despite these positive financial metrics, the stock has faced challenges in the market, with a one-year return of -18.43%, significantly underperforming the Sensex, which gained 6.56% during the same period. This disconnect between strong operational performance and stock price movement suggests that while the fundamentals are solid, investor sentiment has been negatively impacted by technical headwinds and valuation concerns.<BR><BR>Overall, while the financial results are good, the stock's performance indicates some underlying issues that investors should consider. The company is demonstrating strong growth and profitability, but the market's reaction has been less favorable, leading to a cautious outlook.

View full answer

When is the next results date for D.P. Abhushan Ltd?

20-Jan-2026

The next results date for D.P. Abhushan Ltd is January 23, 2026.

The next results date for D.P. Abhushan Ltd is scheduled for January 23, 2026.

View full answer

Is D.P. Abhushan technically bullish or bearish?

05-Dec-2025

As of December 4, 2025, the technical trend is neutral with mixed indicators, showing a mildly bearish daily moving average and bullish weekly MACD, while the Bollinger Bands suggest a mild bullish trend, but overall signals from the RSI and Dow Theory reinforce the lack of strong direction.

As of 4 December 2025, the technical trend has changed from mildly bearish to sideways. The current technical stance is neutral, with mixed indicators influencing this outlook. The weekly MACD is bullish, while the daily moving averages indicate a mildly bearish sentiment. The Bollinger Bands show a mildly bullish trend on both weekly and monthly time frames, but the KST is bearish on the weekly. The OBV is bullish on both weekly and monthly, suggesting accumulation. Overall, the lack of strong directional signals from the RSI and Dow Theory reinforces the neutral stance.

View full answer

How has been the historical performance of D.P. Abhushan?

02-Dec-2025

D.P. Abhushan has shown consistent growth over the past three years, with net sales rising from INR 808.62 crore in March 2020 to INR 1,731.38 crore in March 2022, and profit after tax increasing from INR 16.68 crore to INR 40.53 crore. Despite rising costs, the company improved operational efficiency, reflected in higher operating profit and cash flow from operations.

Answer:<BR>The historical performance of D.P. Abhushan shows a consistent growth trend over the past three years.<BR><BR>Breakdown:<BR>D.P. Abhushan's net sales increased significantly from INR 808.62 crore in March 2020 to INR 1,731.38 crore in March 2022, reflecting a robust growth trajectory. The total operating income followed a similar pattern, rising from INR 808.62 crore to INR 1,731.38 crore during the same period. Despite rising raw material costs and expenditures, the operating profit (PBDIT) improved from INR 34.25 crore in March 2020 to INR 75.35 crore in March 2022, indicating enhanced operational efficiency. Profit before tax also saw a substantial increase, reaching INR 54.70 crore in March 2022, up from INR 22.24 crore in March 2020. Consequently, profit after tax rose from INR 16.68 crore to INR 40.53 crore over the same timeframe. The company's total liabilities increased from INR 268.65 crore in March 2020 to INR 413.61 crore in March 2022, while total assets also grew from INR 268.65 crore to INR 413.61 crore. Cash flow from operating activities improved significantly, moving from INR 7 crore in March 2020 to INR 16 crore in March 2022, although the net cash flow showed a decline in March 2022 with an outflow of INR 6 crore. Overall, D.P. Abhushan has demonstrated strong growth in sales and profits, alongside an increase in both assets and liabilities.

View full answer

Is D.P. Abhushan overvalued or undervalued?

06-Nov-2025

As of November 4, 2025, D.P. Abhushan is considered undervalued with a PE ratio of 22.92 and favorable comparisons to peers, indicating it may be a compelling investment opportunity despite a recent stock decline.

As of 4 November 2025, the valuation grade for D.P. Abhushan has moved from expensive to attractive, indicating a significant shift in its perceived value. The company is currently considered undervalued, particularly when considering its price-to-earnings (PE) ratio of 22.92, price-to-book value of 0.68, and an EV to EBITDA ratio of 23.56. These ratios suggest that the stock may be trading at a discount compared to its earnings potential and asset value.<BR><BR>In comparison to its peers, D.P. Abhushan stands out favorably against Elitecon International, which has a PE ratio of 373.69, and Lloyds Enterprises with a PE ratio of 31.41, both categorized as very expensive. Additionally, PTC India, another peer, is rated very attractive with a significantly lower PE ratio of 7.95. Despite a recent decline in stock performance over the past year, where it returned -13.72% compared to the Sensex's 5.94%, the current valuation metrics suggest that D.P. Abhushan presents a compelling investment opportunity.

View full answer

Who are the top shareholders of the D.P. Abhushan?

17-Jul-2025

The top shareholder of D.P. Abhushan is Ratan Lal Kataria, holding 29.46%, with no pledged promoter holdings. Other notable shareholders include Vijit Vijay Ramavat at 2.93% and individual investors collectively owning 18.8%.

The top shareholders of D.P. Abhushan include the promoters, with Ratan Lal Kataria holding the highest stake at 29.46%. There are no pledged promoter holdings, and the company has 21 foreign institutional investors (FIIs) holding a total of 0.22% of the shares. The highest public shareholder is Vijit Vijay Ramavat, who owns 2.93%. Additionally, individual investors collectively hold 18.8% of the company's shares.

View full answer

Has D.P. Abhushan declared dividend?

06-Jun-2025

D.P. Abhushan Ltd has declared a 10% dividend, amounting to 1 per share, with an ex-date of September 22, 2023. Despite the dividend declaration, the dividend yield is 0%, and total returns have varied, showing a 17.11% gain over the past year but a -4.6% loss in the last 6 months.

D.P. Abhushan Ltd has declared a 10% dividend.<BR><BR>Dividend Details:<BR>- Percentage announced: 10%<BR>- Amount per share: 1 per share<BR>- Ex-date: 22 Sep 23<BR><BR>Dividend Yield: 0%<BR><BR>Total Returns by Period:<BR>In the last 6 months, the price return was -4.6%, the dividend return was 0%, resulting in a total return of -4.6%.<BR><BR>Over the past year, the price return was 17.11%, with a dividend return of 0%, leading to a total return of 17.11%.<BR><BR>For the 2-year period, the price return was 0%, the dividend return was 0%, resulting in a total return of 0.0%.<BR><BR>In the 3-year period, the price return was 0%, the dividend return was 0%, leading to a total return of 0.0%.<BR><BR>For the 4-year period, the price return was 0%, the dividend return was 0%, resulting in a total return of 0.0%.<BR><BR>In the 5-year period, the price return was 0%, the dividend return was 0%, leading to a total return of 0.0%.<BR><BR>Overall, D.P. Abhushan Ltd has declared a dividend, but the dividend yield remains at 0%. The total returns indicate mixed performance, with significant gains in the last year but negative returns in the recent 6-month period.

View full answer
iScoreScore
Click here to find our call on this stock
Strong Sell
Sell
Hold
Buy
Strong Buy

Dashboard

1

Strong ability to service debt as the company has a low Debt to EBITDA ratio of 0.95 times

 
2

Healthy long term growth as Net Sales has grown by an annual rate of 26.49% and Operating profit at 45.95%

 
3

With a growth in Net Profit of 76.96%, the company declared Very Positive results in Jun 26

4

With ROCE of 32.7, it has a Attractive valuation with a 4.2 Enterprise value to Capital Employed

stock-summaryMojo Parameters

Mojo Parameters

Loading Valuation Snapshot...

Stock DNA

stock-summary
Industry

Gems, Jewellery And Watches

stock-summary
Market cap

INR 3,315 Cr (Small Cap)

stock-summary
P/E

15.00

stock-summary
Industry P/E

21

stock-summary
Dividend Yield

0.00%

stock-summary
Debt Equity

0.42

stock-summary
Return on Equity

37.92%

stock-summary
Price to Book

5.55

Revenue and Profits:
Net Sales:
852 Cr
(Quarterly Results - Jun 2026)
Net Profit:
64 Cr
stock-summaryTotal Returns
Total Returns (Price + Dividend) stock-summary
Dividend Yield (0%)
TimePeriod
Price Return
Dividend Return
Total Return
3 Months
49.69%
0%
49.69%
6 Months
21.98%
0%
21.98%
1 Year
-8.5%
0%
-8.5%
2 Years
6.88%
0%
6.88%
3 Years
0%
0%
0.0%
4 Years
0%
0%
0.0%
5 Years
0%
0%
0.0%

Latest dividend: 1 per share ex-dividend date: Sep-22-2023

Risk Adjusted Returns v/s stock-summary
Returns Beta
Icon
Beta has not been calculated since enough price history is not available
stock-summaryNews & Corporate Actions

News

Announcements stock-summary

Board Meeting Outcome for Outcome Of The Board Meeting Held Today I.E. On Saturday August 22 2026

22-Aug-2026 | Source : BSE

We hereby submit Outcome of the Board Meeting held to consider and approve Re-appointment of Mr. Santosh Kataria as MD and Anil Kataria as WTD; to alter Articles of Association; Draft Directors Report for the FY 2025-26; Appoint NSDL as remote e-voting agency and Appointment of M/s. ALAP & Co. LLP as scrutinizer for remote e-voting process.

Announcement Of A New Showroom Of D. P. Jewellers At Jodhpur Under The COCO Model

17-Aug-2026 | Source : BSE

D. P. Abushan Limited announces a new showroom under its brand name "D.P. Jewellers" at Jodhpur Rajasthan under the COCO Model.

Board Meeting Outcome for Outcome Of The Board Meeting Held On Wednesday August 05 2026

05-Aug-2026 | Source : BSE

We hereby submit outcome of the Board Meeting held on Wednesday August 05 2026 to change the address at which the books of account are to be maintained

Corporate Actions stock-summary

stock-summary
BOARD MEETING

No Upcoming Board Meetings

stock-summary
DIVIDEND

D.P. Abhushan Ltd has declared 10% dividend, ex-date: 22 Sep 23

stock-summary
SPLITS

No Splits history available

stock-summary
BONUS

No Bonus history available

stock-summary
RIGHTS

No Rights history available

stock-summaryKey Factors

Quality key factors stock-summary

Factor
Value
Sales Growth (5y)
26.49%
EBIT Growth (5y)
45.95%
EBIT to Interest (avg)
10.26
Debt to EBITDA (avg)
1.63
Net Debt to Equity (avg)
0.42
Sales to Capital Employed (avg)
5.59
Tax Ratio
25.12%
Dividend Payout Ratio
0
Pledged Shares
0
Institutional Holding
0.23%
ROCE (avg)
26.19%
ROE (avg)
28.32%

Valuation key factors

Factor
Value
P/E Ratio
15
Industry P/E
21
Price to Book Value
5.55
EV to EBIT
11.36
EV to EBITDA
11.01
EV to Capital Employed
4.21
EV to Sales
0.86
PEG Ratio
0.16
Dividend Yield
NA
ROCE (Latest)
32.75%
ROE (Latest)
37.92%

Technicals key factors

Indicator
Weekly
Monthly
MACD
Bullish
RSI
Bearish
No Signal
Bollinger Bands
Bullish
Bullish
Moving Averages
Bullish (Daily)
KST
Bullish
Dow Theory
Mildly Bullish
Mildly Bullish
OBV
No Trend
Bullish
stock-summary Technical Indicator Scale: Bearish, Mildly Bearish, Sideways, Mildly Bullish, Bullish  Turned 
stock-summaryShareholding
Shareholding Snapshot : Jun 2026stock-summary
Shareholding Compare (%holding) stock-summary
Majority shareholders

Promoters

Pledged Promoter Holdings

None

Mutual Funds

Held by 0 Schemes

FIIs

Held by 18 FIIs (0.23%)

Promoter with highest holding

Ratan Lal Kataria (29.46%)

Highest Public shareholder

Vijit Vijay Ramavat (2.93%)

Individual Investors Holdings

19.08%

stock-summaryFinancial
[
  {
    "link": "quarterly",
    "btn_text": "All Quarterly Results",
    "header": "Quarterly Results Snapshot (Standalone) - Jun'26 - YoY",
    "rhs": [
      {
        "prefix": "Net Sales ",
        "suffix": "YoY Growth in quarter ended Jun 2026 is 57.74% vs 7.07% in Jun 2025",
        "dir": 1
      },
      {
        "prefix": "Standalone Net Profit ",
        "suffix": "YoY Growth in quarter ended Jun 2026 is 76.96% vs 45.22% in Jun 2025",
        "dir": 1
      }
    ],
    "table": {
      "header": [
        "Jun'26",
        "Jun'25",
        "Change(%)"
      ],
      "body": [
        {
          "field": "Net Sales",
          "val1": "852.40",
          "val2": "540.37",
          "chgp": "57.74%",
          "chgp_class": "positive"
        },
        {
          "field": "Operating Profit (PBDIT) excl Other Income",
          "val1": "92.76",
          "val2": "54.30",
          "chgp": "70.83%",
          "chgp_class": "positive"
        },
        {
          "field": "Interest",
          "val1": "5.28",
          "val2": "4.03",
          "chgp": "31.02%",
          "chgp_class": "negative"
        },
        {
          "field": "Exceptional Items",
          "val1": "0.00",
          "val2": "0.00",
          "chgp": "",
          "chgp_class": "neutral"
        },
        {
          "field": "Standalone Net Profit",
          "val1": "64.45",
          "val2": "36.42",
          "chgp": "76.96%",
          "chgp_class": "positive"
        },
        {
          "field": "Operating Profit Margin (Excl OI)",
          "val1": "10.88%",
          "val2": "10.05%",
          "chgp": "0.83%",
          "chgp_class": "positive"
        }
      ]
    }
  },
  {
    "link": "half-yearly",
    "btn_text": "All Half Yearly Results",
    "header": "Half Yearly Results Snapshot (Standalone) - Sep'25",
    "rhs": [
      {
        "prefix": "Net Sales ",
        "suffix": " Growth in half year ended Sep 2025 is -0.09% vs 48.31% in Sep 2024",
        "dir": -1
      },
      {
        "prefix": "Standalone Net Profit ",
        "suffix": " Growth in half year ended Sep 2025 is 75.02% vs 73.44% in Sep 2024",
        "dir": 1
      }
    ],
    "table": {
      "header": [
        "Sep'25",
        "Sep'24",
        "Change(%)"
      ],
      "body": [
        {
          "field": "Net Sales",
          "val1": "1,508.03",
          "val2": "1,509.41",
          "chgp": "-0.09%",
          "chgp_class": "negative"
        },
        {
          "field": "Operating Profit (PBDIT) excl Other Income",
          "val1": "130.01",
          "val2": "76.21",
          "chgp": "70.59%",
          "chgp_class": "positive"
        },
        {
          "field": "Interest",
          "val1": "7.80",
          "val2": "5.95",
          "chgp": "31.09%",
          "chgp_class": "negative"
        },
        {
          "field": "Exceptional Items",
          "val1": "0.00",
          "val2": "0.00",
          "chgp": "",
          "chgp_class": "neutral"
        },
        {
          "field": "Standalone Net Profit",
          "val1": "87.88",
          "val2": "50.21",
          "chgp": "75.02%",
          "chgp_class": "positive"
        },
        {
          "field": "Operating Profit Margin (Excl OI)",
          "val1": "8.62%",
          "val2": "5.05%",
          "chgp": "3.57%",
          "chgp_class": "positive"
        }
      ]
    }
  },
  {
    "link": "nine-monthly",
    "btn_text": "All Nine Monthly Results",
    "header": "Nine Monthly Results Snapshot (Standalone) - Dec'25",
    "rhs": [
      {
        "prefix": "Net Sales ",
        "suffix": "YoY Growth in nine months ended Dec 2025 is 5.28% vs 45.45% in Dec 2024",
        "dir": -1
      },
      {
        "prefix": "Standalone Net Profit ",
        "suffix": "YoY Growth in nine months ended Dec 2025 is 84.16% vs 91.74% in Dec 2024",
        "dir": -1
      }
    ],
    "table": {
      "header": [
        "Dec'25",
        "Dec'24",
        "Change(%)"
      ],
      "body": [
        {
          "field": "Net Sales",
          "val1": "2,730.41",
          "val2": "2,593.55",
          "chgp": "5.28%",
          "chgp_class": "positive"
        },
        {
          "field": "Operating Profit (PBDIT) excl Other Income",
          "val1": "235.64",
          "val2": "130.99",
          "chgp": "79.89%",
          "chgp_class": "positive"
        },
        {
          "field": "Interest",
          "val1": "12.45",
          "val2": "10.41",
          "chgp": "19.60%",
          "chgp_class": "negative"
        },
        {
          "field": "Exceptional Items",
          "val1": "0.00",
          "val2": "0.00",
          "chgp": "",
          "chgp_class": "neutral"
        },
        {
          "field": "Standalone Net Profit",
          "val1": "161.23",
          "val2": "87.55",
          "chgp": "84.16%",
          "chgp_class": "positive"
        },
        {
          "field": "Operating Profit Margin (Excl OI)",
          "val1": "8.63%",
          "val2": "5.05%",
          "chgp": "3.58%",
          "chgp_class": "positive"
        }
      ]
    }
  },
  {
    "link": "annual",
    "btn_text": "All Annual Results",
    "header": "Annual Results Snapshot (Standalone) - Mar'26",
    "rhs": [
      {
        "prefix": "Net Sales ",
        "suffix": "YoY Growth in year ended Mar 2026 is 22.78% vs 41.49% in Mar 2025",
        "dir": -1
      },
      {
        "prefix": "Standalone Net Profit ",
        "suffix": "YoY Growth in year ended Mar 2026 is 87.97% vs 82.19% in Mar 2025",
        "dir": 1
      }
    ],
    "table": {
      "header": [
        "Mar'26",
        "Mar'25",
        "Change(%)"
      ],
      "body": [
        {
          "field": "Net Sales",
          "val1": "4,065.13",
          "val2": "3,310.79",
          "chgp": "22.78%",
          "chgp_class": "positive"
        },
        {
          "field": "Operating Profit (PBDIT) excl Other Income",
          "val1": "304.48",
          "val2": "172.97",
          "chgp": "76.03%",
          "chgp_class": "positive"
        },
        {
          "field": "Interest",
          "val1": "16.22",
          "val2": "14.44",
          "chgp": "12.33%",
          "chgp_class": "negative"
        },
        {
          "field": "Exceptional Items",
          "val1": "0.00",
          "val2": "0.00",
          "chgp": "",
          "chgp_class": "neutral"
        },
        {
          "field": "Standalone Net Profit",
          "val1": "211.84",
          "val2": "112.70",
          "chgp": "87.97%",
          "chgp_class": "positive"
        },
        {
          "field": "Operating Profit Margin (Excl OI)",
          "val1": "7.49%",
          "val2": "5.22%",
          "chgp": "2.27%",
          "chgp_class": "positive"
        }
      ]
    }
  }
]

Quarterly Results Snapshot (Standalone) - Jun'26 - YoYstock-summary

Jun'26
Jun'25
Change(%)
Net Sales
852.40
540.37
57.74%
Operating Profit (PBDIT) excl Other Income
92.76
54.30
70.83%
Interest
5.28
4.03
31.02%
Exceptional Items
0.00
0.00
Standalone Net Profit
64.45
36.42
76.96%
Operating Profit Margin (Excl OI)
10.88%
10.05%
0.83%
Values in Rs Cr.
Direction Arrows
Net Sales

YoY Growth in quarter ended Jun 2026 is 57.74% vs 7.07% in Jun 2025

Direction Arrows
Standalone Net Profit

YoY Growth in quarter ended Jun 2026 is 76.96% vs 45.22% in Jun 2025

Half Yearly Results Snapshot (Standalone) - Sep'25stock-summary

Sep'25
Sep'24
Change(%)
Net Sales
1,508.03
1,509.41
-0.09%
Operating Profit (PBDIT) excl Other Income
130.01
76.21
70.59%
Interest
7.80
5.95
31.09%
Exceptional Items
0.00
0.00
Standalone Net Profit
87.88
50.21
75.02%
Operating Profit Margin (Excl OI)
8.62%
5.05%
3.57%
Values in Rs Cr.
Direction Arrows
Net Sales

Growth in half year ended Sep 2025 is -0.09% vs 48.31% in Sep 2024

Direction Arrows
Standalone Net Profit

Growth in half year ended Sep 2025 is 75.02% vs 73.44% in Sep 2024

Nine Monthly Results Snapshot (Standalone) - Dec'25stock-summary

Dec'25
Dec'24
Change(%)
Net Sales
2,730.41
2,593.55
5.28%
Operating Profit (PBDIT) excl Other Income
235.64
130.99
79.89%
Interest
12.45
10.41
19.60%
Exceptional Items
0.00
0.00
Standalone Net Profit
161.23
87.55
84.16%
Operating Profit Margin (Excl OI)
8.63%
5.05%
3.58%
Values in Rs Cr.
Direction Arrows
Net Sales

YoY Growth in nine months ended Dec 2025 is 5.28% vs 45.45% in Dec 2024

Direction Arrows
Standalone Net Profit

YoY Growth in nine months ended Dec 2025 is 84.16% vs 91.74% in Dec 2024

Annual Results Snapshot (Standalone) - Mar'26stock-summary

Mar'26
Mar'25
Change(%)
Net Sales
4,065.13
3,310.79
22.78%
Operating Profit (PBDIT) excl Other Income
304.48
172.97
76.03%
Interest
16.22
14.44
12.33%
Exceptional Items
0.00
0.00
Standalone Net Profit
211.84
112.70
87.97%
Operating Profit Margin (Excl OI)
7.49%
5.22%
2.27%
Values in Rs Cr.
Direction Arrows
Net Sales

YoY Growth in year ended Mar 2026 is 22.78% vs 41.49% in Mar 2025

Direction Arrows
Standalone Net Profit

YoY Growth in year ended Mar 2026 is 87.97% vs 82.19% in Mar 2025

stock-summaryCompany CV
About D.P. Abhushan Ltd stock-summary
stock-summary
D.P. Abhushan Ltd
Small Cap
Gems, Jewellery And Watches
D. P. Abhushan Limited was originally formed as a Partnership Firm as "M/s D. P. Jewellers", pursuant to a Deed of Partnership dated April 1, 2003. The name of the Firm was changed to "M/s D. P. Abhushan" dated February 14, 2017. "M/s. D.P. Abhushan" was thereafter converted from partnership firm to Public Limited Company as "D. P. Abhushan Limited" on May 2, 2017. The journey of D.P. Jewellers began in 1940 from Ratlam, a small city of Madhya Pradesh.
Company Coordinates stock-summary
Company Details
138 Chandani Chowk , Ratlam Madhya Pradesh : 457001
stock-summary
Tel: 91-7412-490966/408900
stock-summary
dpj@dpjewellers.com
Registrar Details
Bigshare Services Pvt Ltd , E-2 , Ansa Industrial Estate, Saki Vihar Road, Saki Naka, Andheri (E), Mumbai