
Compare Dalmia Bharat with Similar Stocks
Dashboard
Strong ability to service debt as the company has a low Debt to EBITDA ratio of 1.23 times
Poor long term growth as Operating profit has grown by an annual rate -5.03% of over the last 5 years
Flat results in Mar 26
With ROCE of 8.5, it has a Very Attractive valuation with a 0.9 Enterprise value to Capital Employed
Despite the size of the company, domestic mutual funds hold only 0.01% of the company
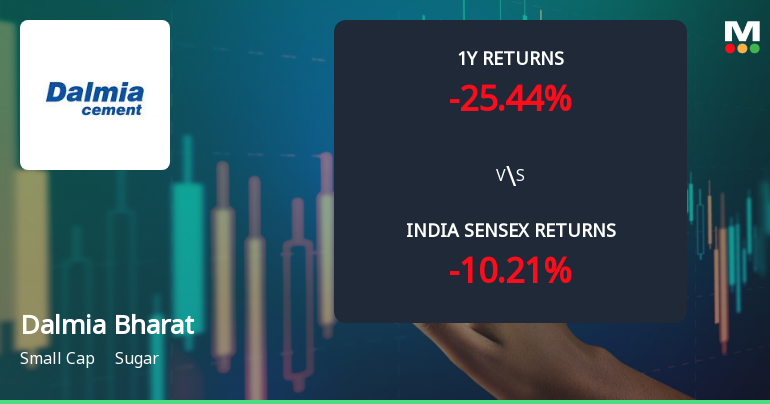
Underperformed the market in the last 1 year
Total Returns (Price + Dividend) 
Latest dividend: 4.5 per share ex-dividend date: Feb-11-2026
Risk Adjusted Returns v/s
Returns Beta

News
Dalmia Bharat Sugar & Industries Ltd: Technical Momentum Shifts Amid Mixed Market Signals
Dalmia Bharat Sugar & Industries Ltd has experienced a notable shift in its technical momentum, moving from a mildly bullish stance to a sideways trend. This transition is underscored by a complex interplay of technical indicators, including MACD, RSI, moving averages, and Bollinger Bands, reflecting a nuanced market sentiment for the sugar sector player amid broader market fluctuations.
Read full news article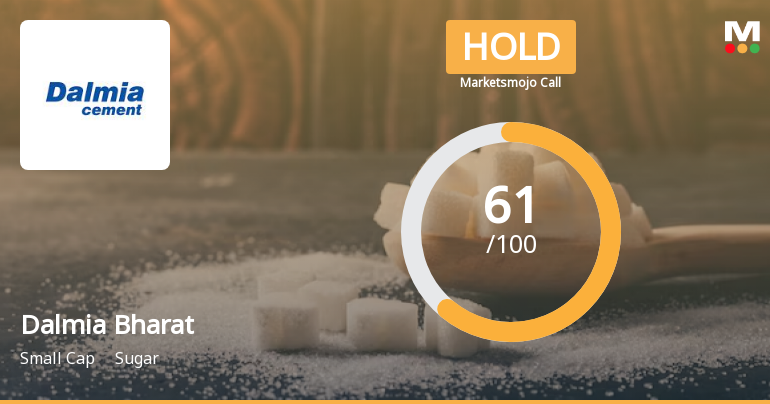
Dalmia Bharat Sugar & Industries Ltd is Rated Hold
Dalmia Bharat Sugar & Industries Ltd is rated 'Hold' by MarketsMOJO, with this rating last updated on 30 April 2026. However, the analysis and financial metrics discussed here reflect the stock's current position as of 10 June 2026, providing investors with an up-to-date view of the company’s fundamentals, valuation, financial trends, and technical outlook.
Read full news article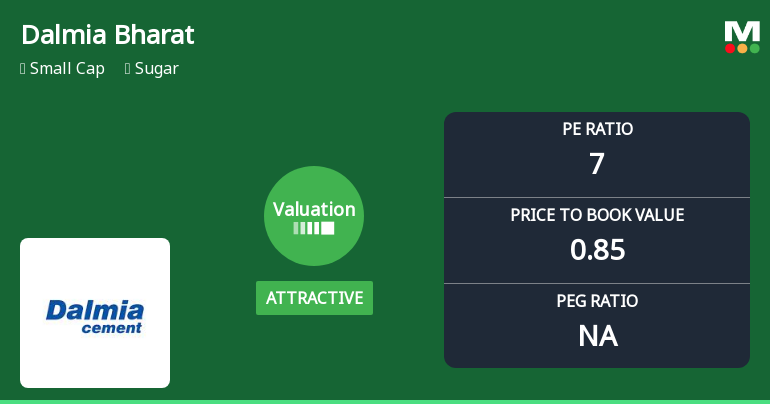
Dalmia Bharat Sugar & Industries Ltd: Valuation Shifts Signal Renewed Price Attractiveness
Dalmia Bharat Sugar & Industries Ltd has witnessed a notable shift in its valuation parameters, moving from a very attractive to an attractive rating, reflecting improved price appeal relative to its historical averages and peer group. This change accompanies a recent upgrade in its Mojo Grade from Sell to Hold, signalling a cautious but positive reassessment by market analysts amid fluctuating sector dynamics and stock performance.
Read full news article Announcements
Announcement under Regulation 30 (LODR)-Amendments to Memorandum & Articles of Association
26-May-2026 | Source : BSEDisclosure pursuant to Regulation 30 of SEBI (LODR) Regulations 2015
Compliances-Reg.24(A)-Annual Secretarial Compliance
21-May-2026 | Source : BSEAnnual Secretarial Compliance Report for financial year ended March 31 2026.
Announcement under Regulation 30 (LODR)-Change in Management
15-May-2026 | Source : BSEDisclosure pursuant to Regulation 30 of SEBI (LODR)
Corporate Actions

No Upcoming Board Meetings

Dalmia Bharat Sugar & Industries Ltd has declared 225% dividend, ex-date: 11 Feb 26

No Splits history available

No Bonus history available

No Rights history available
Quality key factors
Valuation key factors
Technicals key factors
 Technical Indicator Scale: Bearish, Mildly Bearish, Sideways, Mildly Bullish, Bullish Turned
 Shareholding Snapshot : Mar 2026
Shareholding Compare (%holding)
Promoters
None
Held by 1 Schemes (0.0%)
Held by 45 FIIs (0.72%)
Samagama Holdings And Commercial Private Limited (44.32%)
Anil Kumar Goel (5.23%)
20.39%
Quarterly Results Snapshot (Consolidated) - Mar'26 - QoQ

QoQ Growth in quarter ended Mar 2026 is 41.99% vs -29.43% in Dec 2025

QoQ Growth in quarter ended Mar 2026 is 49.97% vs 198.71% in Dec 2025
Half Yearly Results Snapshot (Standalone) - Sep'25
Growth in half year ended Sep 2025 is 3.09% vs 19.54% in Sep 2024
Growth in half year ended Sep 2025 is -41.75% vs -7.58% in Sep 2024
Nine Monthly Results Snapshot (Standalone) - Dec'25
YoY Growth in nine months ended Dec 2025 is -3.03% vs 26.06% in Dec 2024
YoY Growth in nine months ended Dec 2025 is -20.62% vs -6.51% in Dec 2024
Annual Results Snapshot (Consolidated) - Mar'26
YoY Growth in year ended Mar 2026 is -2.87% vs 28.47% in Mar 2025
YoY Growth in year ended Mar 2026 is -35.23% vs 34.14% in Mar 2025
About Dalmia Bharat Sugar & Industries Ltd

Company Coordinates


